
WGU C207 Course Roadmap: Data-Driven Decision Making

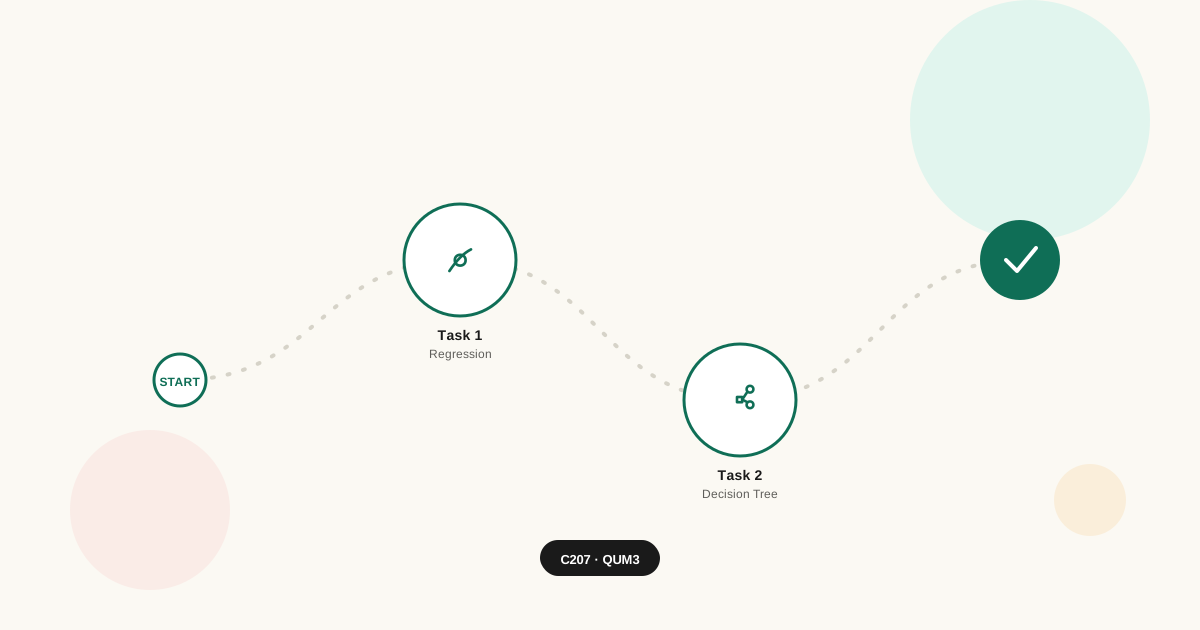
C207 Course Roadmap
Quick Facts
| Course type | Performance Assessment (PA) — a data analysis project, not a multiple-choice exam |
| Assessment code | QUM3 — two tasks, Task 1 and Task 2 |
| Format | Each task uses a shared scenario with one of three possible datasets, assigned by the last digits of your WGU ID |
| Typical timeline | 2–4 weeks per task, depending on your existing stats comfort |
| Core skills tested | Linear regression (Task 1), decision tree analysis (Task 2), business recommendation writing |
What This Course Actually Covers
C207 runs across six modules, and knowing what each one is actually for saves you from treating them as equally weighted when they’re not:
- The Case for Quantitative Analysis — the “why” module. Analytics as a discipline, why data-backed decisions beat gut calls. Mostly conceptual, low risk, don’t over-invest time here.
- Statistics as a Managerial Tool — the heaviest module. Descriptive and inferential statistics, probability, correlation, regression, hypothesis testing, ANOVA. This is where most of your actual assessment content comes from.
- Quantitative Decision Tools — decision tree analysis and structured decision models (including the Davenport-Kim three-stage model: frame the problem, solve the problem, communicate results).
- Quality Management Basics — Six Sigma, Lean, ISO — quality frameworks that show up in the “so what” section of your recommendations.
- Real World Data-Driven Decisions — applying the above to actual business scenarios, which is functionally a preview of what your PA will ask you to do.
- Improving Organizational Performance — KPIs, balanced scorecards, tying data analysis back to organizational goals.

Module 2 is the load-bearing wall of this course. If your stats background is thin, that’s where to spend disproportionate time before touching your actual dataset.
What the Assessment Actually Asks For
C207’s PA (QUM3) runs across two distinct tasks, each with its own scenario and shared dataset pool:
- Task 1: Linear Regression Analysis — you’re given a scenario and one of three datasets, and asked to run a linear regression analysis, interpret goodness of fit and statistical significance, and recommend a course of action based on the results.
- Task 2: Decision Tree Analysis — a different scenario, again with one of three shared datasets, asking you to build a decision tree, calculate expected values across multiple alternatives, and recommend a primary and backup course of action.
Both tasks use scenarios and datasets that are identical across every student assigned that dataset number — not fully unique per student. That matters practically: it means a huge amount of shared “help” content exists for both tasks online, some of it functioning as a direct answer key. Our guides for both tasks are deliberately built around fictitious scenarios instead, teaching you the exact method so you can apply it correctly to your own assigned numbers.
Where Students Actually Lose Points
- Picking the wrong statistical test for the question being asked — correlation when regression was needed, or a hypothesis test framed around the wrong variable
- Misreading or misreporting a p-value — treating “statistically significant” as “definitely true” or vice versa, without engaging what significance actually means for the business decision
- A decision tree that’s technically built but never actually used — running the calculation, then writing recommendations that don’t reference it
- Recommendations that float free of the data — a sound analysis followed by generic business advice that could have been written without ever opening the dataset
- Getting the mechanics right, the interpretation wrong — correct formulas, but the write-up doesn’t explain what the number means for the business situation
That last one is the most common gap: this course tests your ability to translate a statistical result into a business decision, not just your ability to run the calculation.

Task-by-Task Guides
Each task gets its own full rubric-by-rubric guide, cross-linked so you can move between them if you’re working on both:
- C207 QUM3 Task 1 Guide: Linear Regression Analysis — every rubric aspect (A1 through F) broken down, with a fictitious worked example and a downloadable Cause-Effect-style reference for structuring your write-up. → See also: Task 2 Guide
- C207 QUM3 Task 2 Guide: Decision Tree Analysis — every rubric aspect (A1 through G) broken down, with a fictitious expected-value walkthrough you can mirror against your own dataset. → See also: Task 1 Guide
If you’re tackling both tasks in the same study session, the two share some conceptual DNA — Task 1’s discussion of statistical significance and Task 2’s discussion of probability-weighted outcomes both come back to the same core skill: translating a number into a business judgment call. Reading both guides back to back reinforces that connection rather than treating them as unrelated tasks.
Key Concepts Worth Understanding Deeply
Supporting Task 1 (Regression):
- What Is Hypothesis Testing? (In Plain Language)
- Understanding P-Values Without the Jargon
- Descriptive vs. Inferential Statistics: What’s the Difference?
- How to Interpret R² Without Overselling It
Supporting Task 2 (Decision Tree):
- Decision Tree Analysis, Explained
- Expected Value: How to Calculate and Interpret It
- The Davenport-Kim Three-Stage Decision Model
Supporting both:
Templates and Study Aids
- Statistical-test-selection-cheat-sheet— which test for which question
- Decision-tree-diagram-worksheet— a fillable structure for organizing alternatives, probabilities, and payoffs before you build your final diagram
Staring at your dataset with no idea where to start? Jump straight to the Task 1 Guide (regression) or Task 2 Guide (decision tree) — each walks the entire rubric step by step.
References & Further Reading
- Huynh, M.-T. (2025). Individual Data-Driven Mindset and Decision-Making Performance: The Mediating Roles of Effort and Persistence. Information Systems Frontiers, 27(6), 2511–2538. — A recent peer-reviewed study examining how a data-driven mindset actually translates into better decision quality — directly relevant to why this course exists, not just how to pass its assessments.

Disclaimer
This roadmap is an independent study aid based on C207’s publicly documented course structure. It’s not affiliated with or endorsed by WGU. Both linked task guides use entirely fictitious scenarios and data to teach the underlying method — neither references the actual shared scenarios, datasets, or numbers assigned to any student.