
C207 Task 2 Example: How to Nail Every Rubric Line on Your Decision Tree Analysis (QUM3)


C207 Task 2
Updated on: Aug 14, 2026
Part of the C207 Course Roadmap — see also the QUM 3 C207 Task 1 Guide (Linear Regression Analysis).
Quick Facts
| Course | C207 — Data-Driven Decision Making |
| Assessment | QUM3 — Task 2: Decision Tree Analysis |
| Format | Performance Assessment — decision tree diagram + written report |
| Software | Excel required for full functionality of the scenario/dataset file |
| Rubric aspects | 7 scored components across sections A through G |
| Submission check | Automatic similarity scan and Grammarly for Education review before evaluation |
The Assignment
Introduction
Managers are required to organize, interpret, and display data that is reliable and relevant to the real-world decisions they must make in their businesses. The use of analytical tools will improve your ability to use data to make informed decisions.
In this task, you will address the business situation in the attached scenario. You will access the scenario and dataset by entering your student ID number in the “Start” tab of the “Decision Tree Analysis Resources” document found in the Supporting Documents section. The scenario and dataset are located in the “Decision Tree Scenario” tab. Using this dataset, you will perform a decision tree analysis and recommend a solution.
This recommendation will be included in a report you will write summarizing the key details of your analysis.
For full functionality of the scenario and data attachment, you must use Microsoft Excel, which is available via the Microsoft Office 365 subscription service provided to all WGU students. It can be downloaded using the “Microsoft Office 365” link in the Web Links section.
Scenario
Refer to the scenario located in the supporting document, “Decision Tree Analysis Resources.”
Requirements
Your submission must represent your original work and understanding of the course material. Most performance assessment submissions are automatically scanned through the WGU similarity checker.
Students are strongly encouraged to wait for the similarity report to generate after uploading their work and then review it to ensure Academic Authenticity guidelines are met before submitting the file for evaluation. See Understanding Similarity Reports for more information.
You must use the rubric to direct the creation of your submission because it provides detailed criteria that will be used to evaluate your work. Each requirement below may be evaluated by more than one rubric aspect. The rubric aspect titles may contain hyperlinks to relevant portions of the course.
Complete your decision tree analysis and create a report by doing the following:
Note: The supporting document “Decision Tree Analysis Resources” contains a scenario, data set, and template. While you must use the scenario and data set provided in the supporting document, the template is optional. You are encouraged to use the template to complete your analysis. Please see supporting document, “QUM3 Task 2 Getting Started,” for help accessing the scenario and dataset.
C207 Task 2 Example
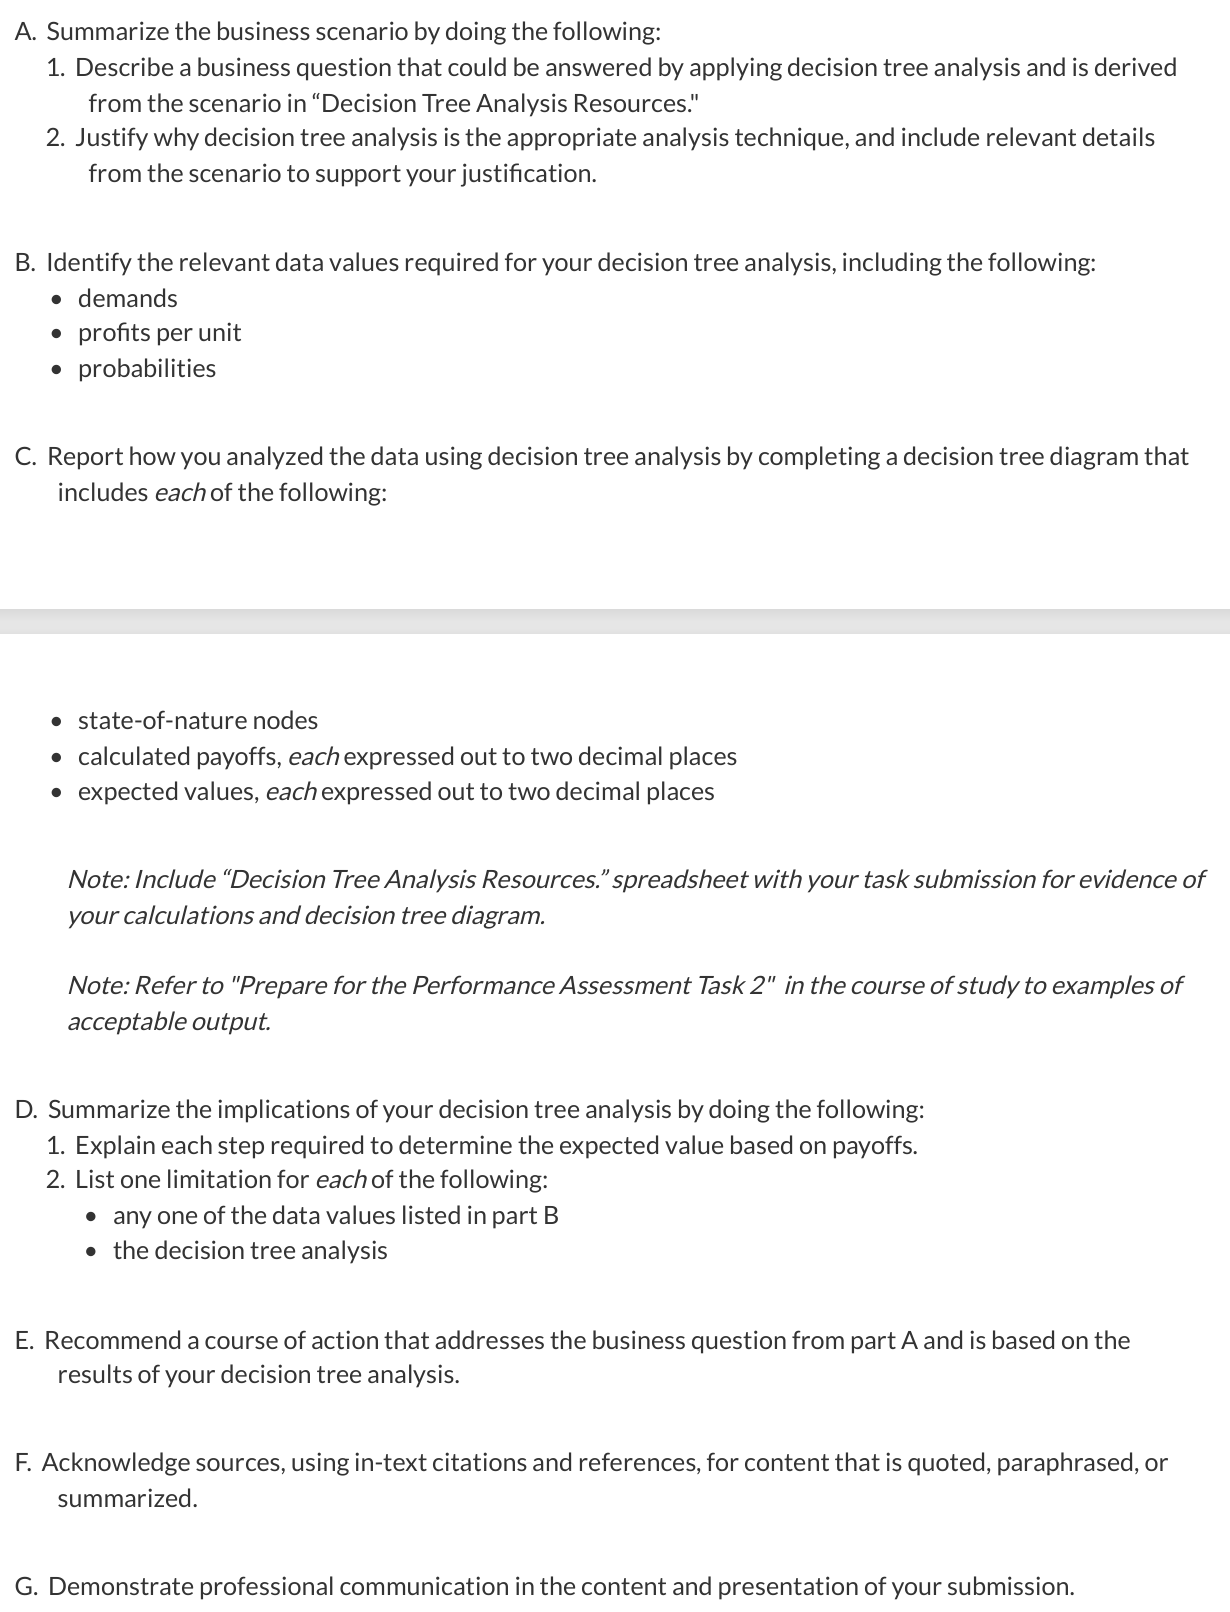
A1: Describing the Business Question
In this scenario, the decision is whether to develop a new drug line, exploit the existing one for potential new applications, or continue with the existing one. Therefore, the question is: Should MPC develop a new drug line, exploit the existing one for potential new applications, or continue with the existing line to achieve the highest expected financial return under uncertain market conditions?
A2: Justifying Decision Tree Analysis as the Right Technique
Decision tree analysis is appropriate because MPC faces three discrete alternatives, each with two possible market conditions (favorable and unfavorable) with estimated probabilities, and each combination produces a quantifiable payoff based on demand and profit per unit; exactly the structure decision tree analysis is built to evaluate.
B: Identifying the Relevant Data Values

C: Building the Decision Tree Diagram
D. Implications of the Decision Tree Analysis
D1. Explanation of Expected Value Calculation
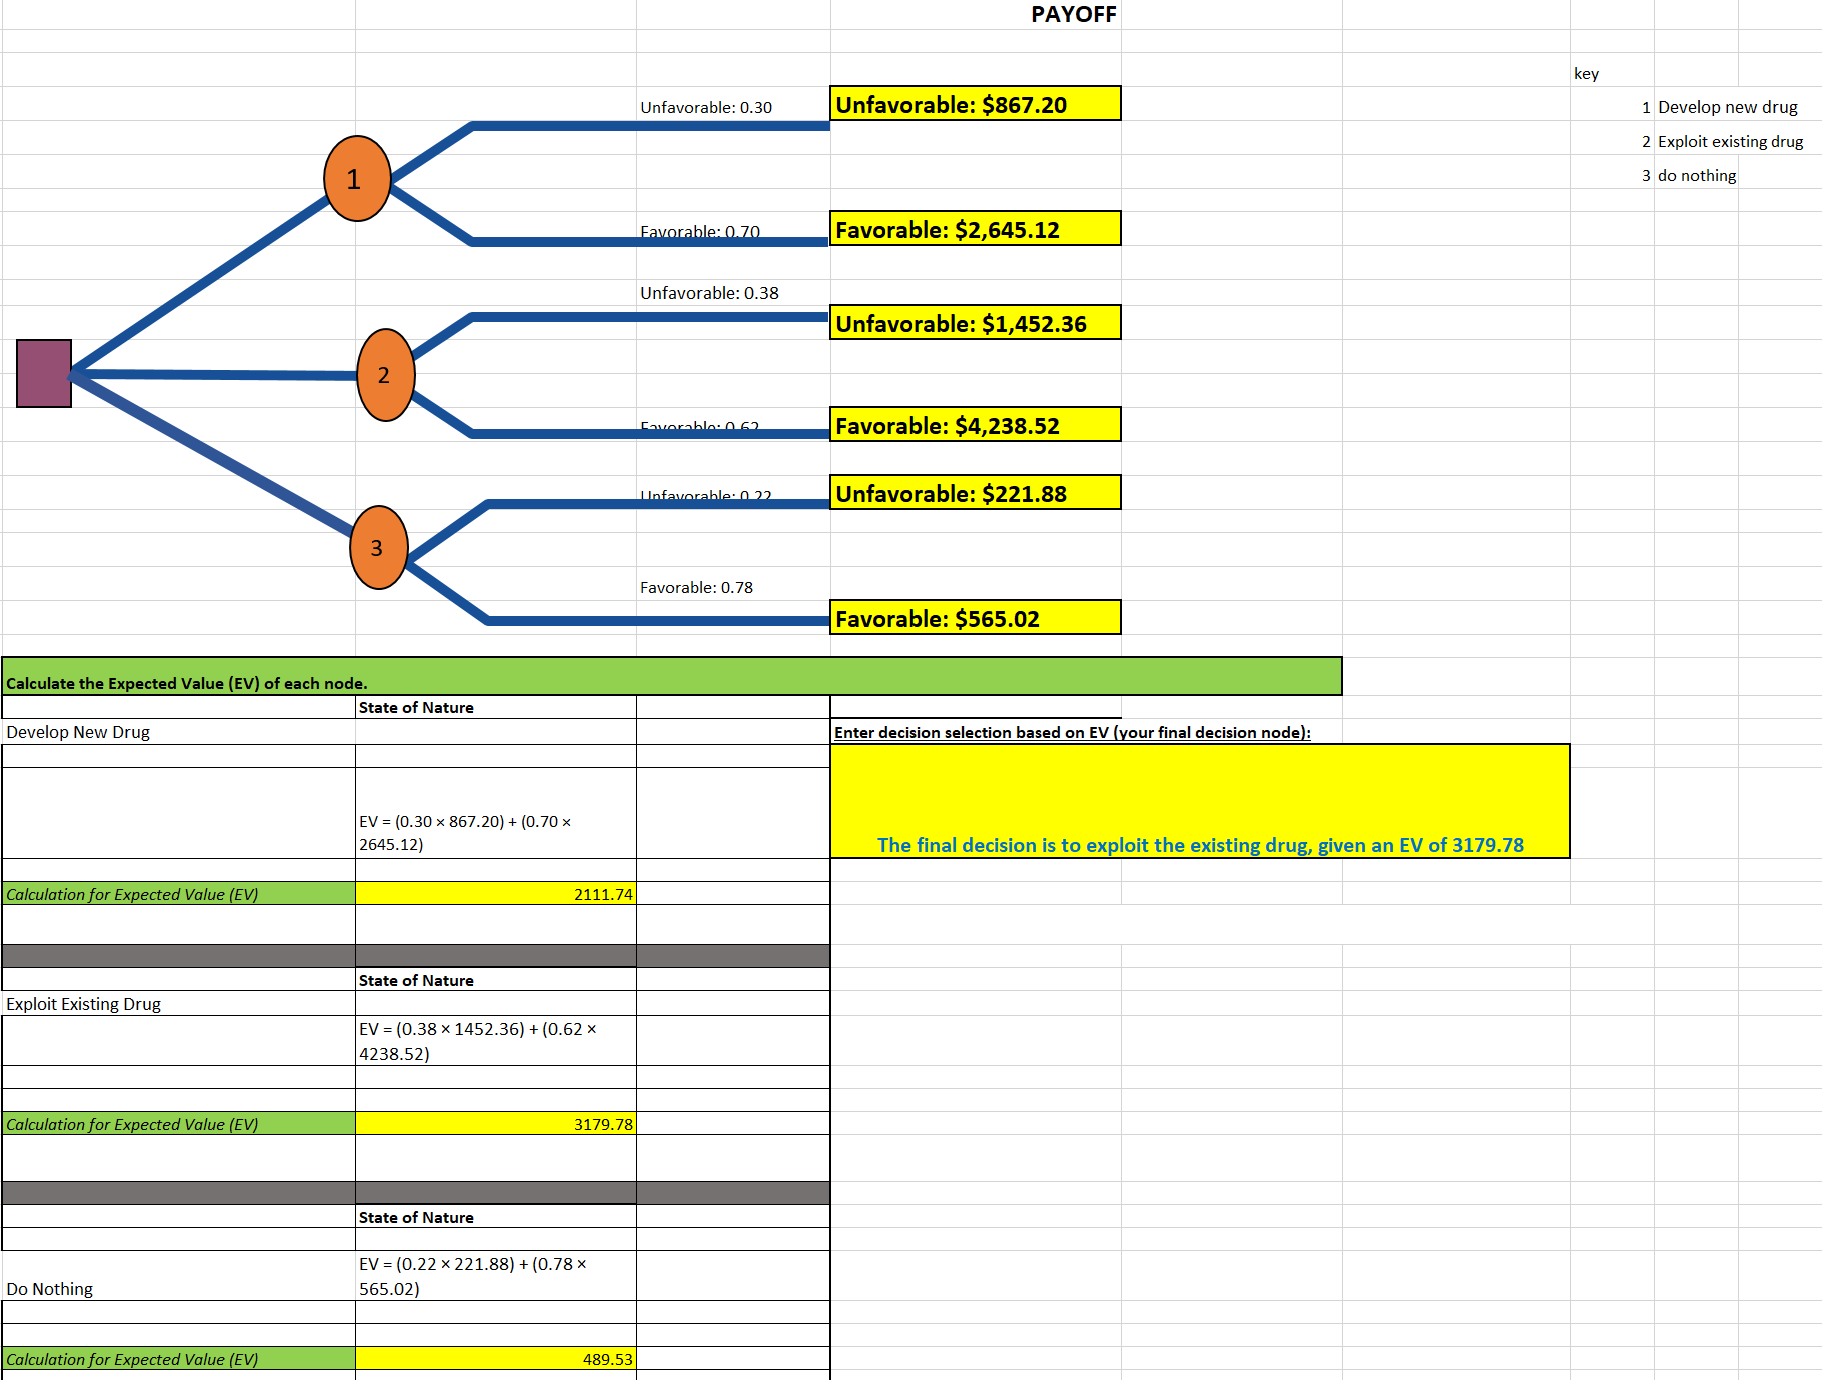
To calculate the expected value (EV) for each decision option, multiply each market scenario’s payoff by its probability and sum the results. For instance, the development of a new drug alternative contains an unfavorable payoff of $867.20 and a probability of 0.30, and a favorable payoff of $2,645.12 and a probability of 0.70. The EV of this option equals the sum of the product of each payoff and probability. The same procedure was followed for the other two options. By comparing the EVs of the three options, we determine which is most likely to yield the greatest financial outcome in a risky market environment.
D2. Limitations
A potential limitation of the data is that demand estimates may not be accurate. These estimates are derived from research and assumptions that could be influenced by competitors’ actions, regulatory changes, and other market factors. If the market demand is significantly different from the estimates, then the payoffs, and by extension the EVs, would also vary. Another potential issue with decision trees is that they assume probabilities are static and known precisely, which is unlikely in real markets. Decision trees also reduce the environment to a set of distinct outcomes, which may not account for other factors such as long-term effects on brand positioning, resource constraints, or changing market preferences.
Section E. Recommended Course of Action
The decision tree analysis suggests MPC should leverage the existing drug for new FDA applications because this strategy has the highest expected value of $3,179.78. This course of action answers the business question by recommending the decision with the highest expected value, given uncertain market conditions. The much higher EV relative to the development of a new drug and doing nothing suggests that building on the existing drug line is the most attractive combination of profitability and likelihood of success. This strategy will allow MPC to make the most profits with the least risk.
Other related Content
WGU D361 Task 1: Business Performance Report (Marketplace Simulation)
WGU C206 Task 1 Guide: How to Build a Professional Communication Portfolio
WGU C205 Task 1 Guide: Leading Teams — Team Dynamics and Group Development (KUM1)
WGU C206 Task 2 Guide: Ethics Audit, Ethical Dilemmas, and Training Program Design
Common Mistakes to Avoid
- Building the tree before organizing the underlying data, leading to mismatched probabilities and payoffs
- Rounding at different points in the calculation, producing expected values that don’t match a consistent two-decimal standard
- Writing D1 as a results table instead of an explained process
- Providing a limitation that’s vague (“the data might be wrong”) instead of tied to a specific value or a documented weakness of the technique
- Recommending an alternative without explicitly connecting the recommendation to your calculated expected values
- Forgetting the backup recommendation the scenario specifically asks for
Perfect-Score Self-Check
- Does my business question name specific alternatives and fit the “which option maximizes expected value” shape?
- Have I identified demands, profits per unit, and probabilities for every alternative in part B?
- Are all my payoffs and expected values rounded consistently to two decimal places?
- Does my D1 explanation walk through the calculation steps, not just show the answer?
- Do I have one limitation tied to a specific data value and one tied to the technique itself?
- Does my E recommendation explicitly reference my calculated expected values, including a backup option?
- Have I cleared the Grammarly for Education check?
References & Further Reading
- Lee, C. S., Cheang, P. Y. S., & Moslehpour, M. (2022). Predictive Analytics in Business Analytics: Decision Tree. Advances in Decision Sciences, 26(1), 1–29. — A peer-reviewed paper on decision tree methodology in business analytics, including the technique’s sensitivity to input variation — the academic basis for this guide’s D2 technique-limitation discussion.
Frequently Asked Questions
- Is the pharmaceutical company scenario used in this guide’s examples? No. Every C207 QUM3 Task 2 student receives the same Major Pharmaceutical Company scenario and one of three shared datasets, so this guide uses a fictitious coffee roasting scenario (Alderbrook Coffee Roasters) to demonstrate the method without answering the actual shared prompt.
- Does this guide calculate my actual expected values for me? No. Your dataset is one of three assigned by your student ID and isn’t visible to us. This guide walks through the calculation process on fictitious numbers so you can apply the identical steps to your real data.
- Do I need both a primary and backup recommendation? Check your specific scenario document, but this task’s scenario typically asks the decision-maker for both an immediate action and a backup — worth including both even if the rubric language doesn’t spell it out explicitly, since it directly addresses what the scenario’s stakeholder is asking for.
- Is getting help with this task against WGU’s academic integrity policy? Tutoring, coaching, and editing support are a normal, accepted part of studying; most university policies explicitly support students getting this kind of help. Our role is to help you understand and interpret your own output, which fits well within that.