
WGU D361 Task 1: Business Performance Report (Marketplace Simulation)

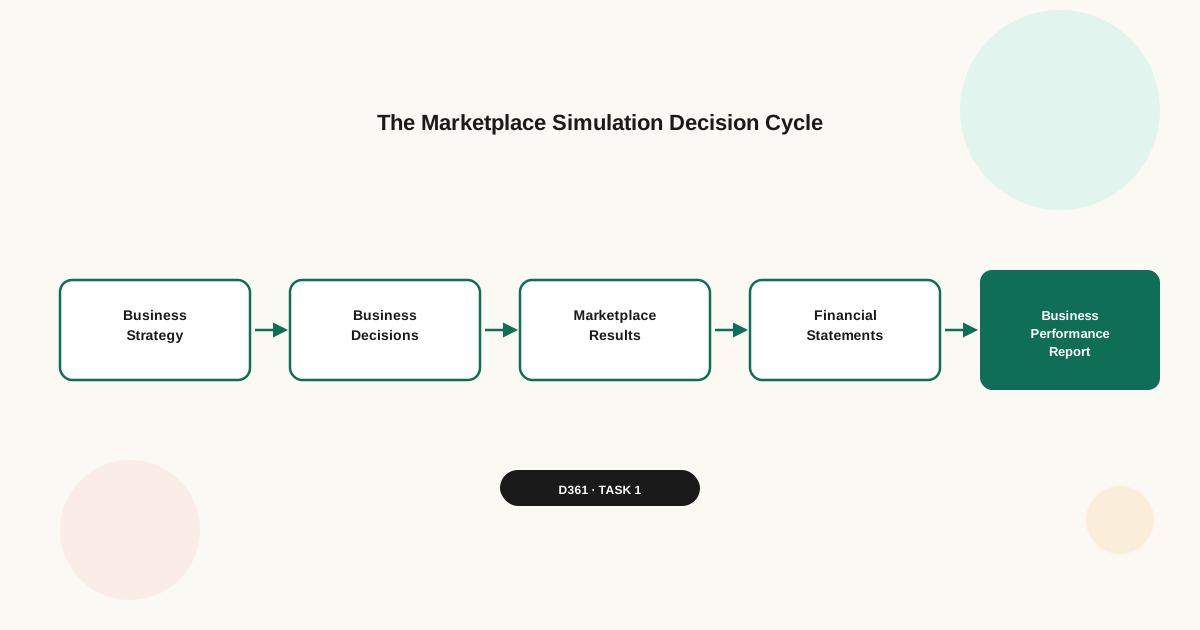
Updated on: Sep 3, 2026
D361 Task 1 Assignment
Introduction
Before you begin this task, you must complete and pass the Marketplace Simulation business simulation with a score of 0.001 or higher. If the simulation is not completed with the passing cut score of 0.001 or higher, your task will be returned, and you will be required to contact your instructor and re-play the simulation.
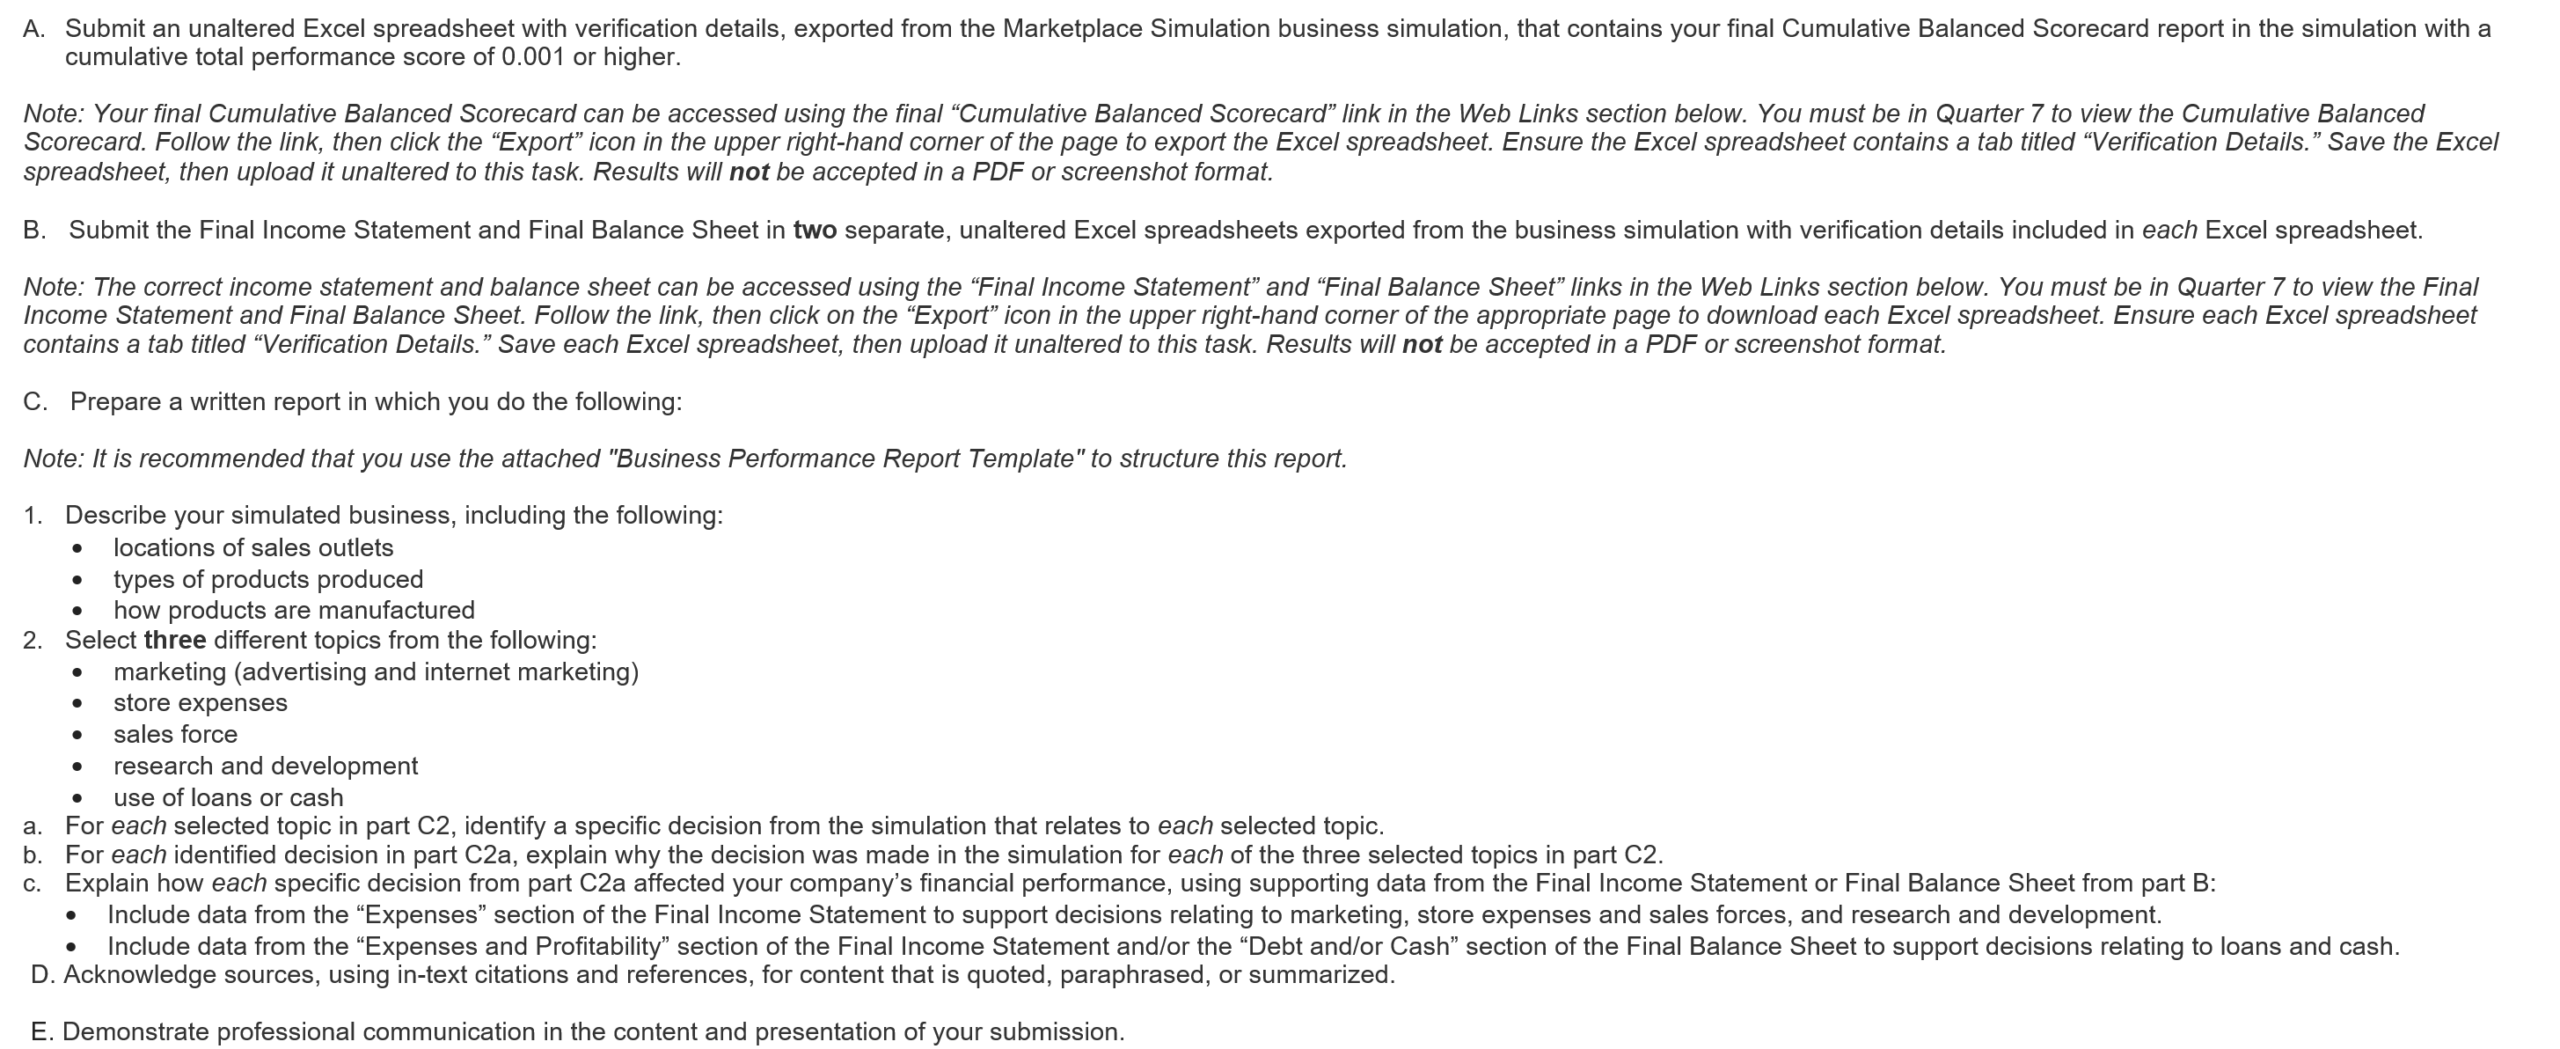
Note: When completed, you will upload four total documents: three Excel spreadsheets with verification details and the attached “Business Performance Report Template” in a Word or PDF format. Your four documents should be as follows:
- Cumulative Balanced Scorecard
- Final Income Statement
- Final Balance Sheet
- Business Performance Report Template
In this task, you will provide evidence of the successful completion of the Marketplace Simulation business simulation and then produce a written report using the attached “Business Performance Report Template” to analyze the performance of your simulated business.
You must receive confirmation that you successfully passed Task 1: Business Performance Report before submitting Task 2: Competitive Analysis of this performance assessment
Scenario
You are responsible for overseeing a bicycle start-up company. You led this company through its first six quarters, making strategic and tactical decisions to create a successful business in a competitive marketplace.
As a leader in your business, you are responsible for reporting to other stakeholders on the performance of your business during its first six quarters. Your report will provide a detailed overview of the financial performance of the business. It should provide a data-driven analysis of your business decisions and the outcomes of those decisions.
D361 Task 1 Example
Cycle 2 The Future
Business Performance Report
Student ID:
Date:
C1. Business Overview
The simulated company is a bicycle manufacturing and retail start-up operating in a highly competitive sector. Given the increased calls for sustainability living and the reduction of fossil fuel emissions, multiple bicycle manufacturing and retail have been emerging but are yet to address the market demand and needs (Xames et al., 2023). The business deals with 3D-printed carbon fiber bicycles, developed to test demand and scalability in multiple global markets. The business will begin by exproring the New York markert, before switching to Rio de Janeiro, then Amsterdam, and subsequently Bangalore. The opening of these outlets aligns with the demand-led market entry strategy, where focus is on locations with robust cycling cultures, higher disposable income, and early adoptions to minimize risks of early failures (Puneeth & Nethravathi, 2021).
The firm produces a diversified portfolio of bicycles to appeal to multiple customer segments. The speed segment bicycles consumers looking for the lightest, fastest, most aerodynamic bike on the market. The second pool of product is mid-range recreational bicycles targeting casual and fitness cyclists. Lastly, the brand features consumers that use a bicycle for adventure, exercise, and sport. Also, they like the challenge of riding on difficult terrain. Featuring a wide range portfolio increases the ability of the firm to post good financial performances. The business focused on custom-built upon order, where production volume correlated with observed demand. By eliminating finished-goods inventory, the brand is able to achieve rapid design adjustments in response to customer preferences.
The manufacturing technique for products was a centralized micro-factory model. The technique involves the assembling of different part at a central plan. The approach was crucial in ensuring quality, capital investment moderation and application of unique research and development models. This approach supported a SMART operational objective of reducing unit production costs by at least 15% within six quarters while maintaining quality. Overall, the brand pursued a SMART growth strategy involving boosting the brand’s presence, low manufacturing and operational costs and targeting unmet demand.
C2. Financial Analysis
The simulation process features three critical topics for financial management. These three topics were:
- Marketing (advertising and internet marketing)
- Store expenses
- Research and development
Advertising and Internet Marketing
Several decisions made during the business simulation that relates to Marketing (advertising and internet marketing). Specifically, during the simulation process, focus was on internet marketing. Internet or digital marketing entails all practices that aims at creating brand awareness and reaching target customers who include cycling enthusiasts, commuters, and younger demographics.
The selection of internet advertisement was contributed to consumer trends and perceived impact on financial performances. For a start, the changing consumer behavior, where bicycle buyers were increasingly researching products online before visiting physical stores triggered a need to align with the trend. Although traditional marketing practices were effective, switching to a cost-effective alternative like digital was inevitable. Also, the switch was contributed the option’s measurable performance metrics that would boost financial performances analysis. Given that digital platforms utilized data to prove performance, it assisted with better allocation of marketing resources.
The growth in internet marketing expenses across the quarter and growth of earnings before interest and taxes proves the impact of the inclusion of the element. The internet marketing expenses grew from $ 9,000 in Q3 to 44,000 in Q6, while those of advertising shrunk from $ 76,549 in Q3 to 75,062 in Q6 suggesting switch to the former. At the same time, EBIT grew from $ -1,113,434 in Q4 to $-528,325 in Q6. Although sales performances and other expenses were involved in the improved profitability performances, internet marketing could explain the growth in online purchasers.
Store Expenses
The simulation selected to maintain a high level of store operating expenses across all six quarters, particularly after expanding retail presence. Store expenses are every cost associated with operating the company’s physical outlets. This expense is crucial during financial planning and management. As part of store expenses, the firm focused on prime locations, in-store staff training and quality customer service experiences.
The decision to invest significantly on store expenses was informed by the need for customer acquisition, product testing, and after-sales service. The management understood early that investing in stores was crucial in attracting consumers who prefer store experience over online platform. These walk-through customers prefer locations that meet their tastes and preferences, which explains the need for massive investments. Furthermore, the management understood that product testing was essential before the purchase of the product, which explain the decision to invest in areas where testing would be convenient, while customers enjoy the entire process. Lastly, the management needed an outlet, where customers can make inquiry post-purchase, which improves its reputation as a customer-friendly brand.
The decision to increase stores expenses had significant effect on overall income statement performances. Notably, the item was one of the leading cost drivers outside excess capacity cost and R&D. The stores revenues were $ 200,000 in Q1 and $ 136,000 in Q6. Despite the decrease in store expenses across simulation, it remained a leading cost driver. The high expense rate was also responsible for overall operating losses in the early stages of the business. However, the management argued that that reducing store expenses too early would undermine brand credibility and customer experience.
Research and Development
The company chose to invest significantly in R&D in earlier quarters before gradual reduction in the final quarters, including Quarter 6. R&D is paramount to a technology driven firm such as this bicycle producer. The department is responsible for introducing new designs and its investment depends on a brand’s strategic practice.
The early massive investment was critical because of multiple reasons. Firstly, massive investment was crucial for the development of competitive bicycle designs. Given that the firm is operating in a competitive sector and consumer preferences keep changing, innovation led by R&D department was vital. Heavy investment in R&D ensures the development of new prototypes consistently (Looney et al., 2022). Additionally, it was necessary for the business to improve product reliability and performance. Investing in R&D guarantees the improvement of the quality of a product as any defect is spotted and dealt with earlier (MengDie et al., 2023). Moreover, investment in R&D was responsible for the establishment of a differentiated product lineup. The reduction in R&D investments in the latter stages was contributed by the need to preserve cash and redirect funds toward marketing and store operations. This decision reflects a transition from product development to market expansion.
The R&D investment had massive impact on the profitability performances of the company. Notably, the item was the leading cost driver, especially in Q4 and Q5, where the total values were $1,001,786 and $ 422,489 respectively. However, the decline in costs in the later periods helped reduce total operating expenses in later quarters, partially offsetting rising marketing and store costs. The reduction not only eased cost burden on profits, but also it prevented scenarios where if competitors continue innovating and margins decrease. Overall, the decision to manage R&D cost helped turn-around the brand’s performances.
In conclusion, the financial performance of the business during its first six quarters reflects a growth-oriented strategy. Decisions to invest in marketing, store expenses, and research and development were keen on growth rather than maximizing early profits. Although these decisions contributed in financial losses in the initial quarters, they positioned the company for sustainable growth and improved profitability in future periods. Accordingly, it can be argued that in the first six quarters of the simulation, the strategic decisions made aligns with a start-up operating in a competitive industry.
D. References
Looney, E., Buscariolli, A., Yang, M., Raymond, G., Buonassisi, T., & Peters, I. M. (2022). Prototyping styles accelerate hardware development. doi:10.26434/chemrxiv-2022-k4dk
MengDie, Z., ShiYu, L., Law, S. H., & Ong, T. S. (2023). Economic policy uncertainty, government subsidy and R&D investment: evidence from the Chinese pharmaceutical manufacturing industry. Economic Policy, 31(2). http://10.57030/23364890.cemj.31.2.9 83
Puneeth, B. R., & Nethravathi, P. S. (2021). Bicycle industry in India and its challenges—A case study. International Journal of Case Studies in Business, IT and Education (IJCSBE), 5(2), 62-74. http://doi.org/10.5281/zenodo.3976932
Xames, M. D., Shefa, J., & Sarwar, F. (2023). Bicycle industry as a post-pandemic green recovery driver in an emerging economy: a SWOT analysis. Environmental Science and Pollution Research, 30(22), 61511-61522. https://10.1007/s11356-022-21985-2

PAGE 1
Converted to HTML with WordToHTML.net | Document Converter for Windows

D361 Task 1 Common Mistakes
- Describing a decision without explaining why it was made
- Listing financial numbers without interpreting what they mean
- Treating your three topics as unrelated, when the strongest reports show how they interacted
- Using opinion or intuition (“it felt right”) instead of citing financial evidence
- Confusing revenue growth with profit growth; a strong quarter for one doesn’t guarantee the other
- Never explicitly naming which financial statement line supports a given claim
- Picking a topic because it sounds impressive rather than because you have strong supporting data for it
Self-Assessment Checklist
- Have I described my simulated company specifically; locations, products, manufacturing approach?
- Have I selected three topics where I have both a clear decision and strong supporting evidence?
- Have I explained why each decision was made, not just what the decision was?
- Have I supported every conclusion with a specific line item from my Income Statement or Balance Sheet?
- Have I connected strategy to performance explicitly, rather than describing them side by side?
- Would an executive reading this understand my reasoning without needing to ask a follow-up question?
Frequently Asked Questions
Which three topics should I choose? Whichever three give you the clearest decision paired with the strongest financial evidence in your own results — not necessarily the three that sound most strategic in the abstract.
Can I discuss the same financial statement twice across different topics? Yes — the Income Statement in particular will likely support more than one of your three topics, since marketing, sales force, and R&D expenses all live in the same Expenses section.
Do I need to include actual calculations in my report? The task doesn’t require formal ratio calculations, but citing specific figures (dollar amounts, percentage changes) from your statements makes your evidence far more concrete than a general description.
How much financial data should I reference? Enough that a reader could verify your claim by looking at the same line item themselves — vague references (“expenses went up”) are weaker than specific ones (“marketing expense increased by approximately $12,000 in Quarter 3”).
What if one of my decisions produced poor results? That’s still valid material — the rubric asks you to explain the impact of a decision, not to prove every decision succeeded. A well-reasoned explanation of a decision that didn’t pay off, including what the data shows about why, often demonstrates stronger analytical thinking than a report where everything worked out perfectly.
Can negative outcomes still receive full marks? Yes, provided your analysis is logical, well-supported by your actual data, and clearly explains the connection between the decision and the result — the rubric evaluates your reasoning, not whether your simulated business had a perfect run.

Related Learning Resources
- WGU D361 Task 2 Guide: Competitive Analysis (SWOT, Strategic Graphs, SMART Goals)
- D361 Task 1 Revision Help: Understand Feedback and Prepare Your Resubmission
- D361 Task 1 Review Service: Get Your WGU Draft Reviewed Before Submission
- D361 Task 1 Help: Get Practical Support With Your WGU Submission
- WGU C203 Task 1 Guide: Personal Leadership Assessment and Profile
- WGU C206 Task 2 Guide: Ethics Audit, Ethical Dilemmas, and Training Program Design
- WGU C205 Task 1 Guide: Leading Teams — Team Dynamics and Group Development (KUM1)
- WGU C206 Task 1 Guide: How to Build a Professional Communication Portfolio
- C207 QUM3 Task 2 Guide: How to Nail Every Rubric Line on Your Decision Tree Analysis
- C207 QUM3 Task 1 Guide: Regression Analysis Example