
C207 QUM3 Task 1 Example and Guide: Regression Analysis – Data-Driven Decision Making C207 PRFA


Updated on: Aug 14, 2026
C207 QUM3 Task 1 Quick Facts
| Course | C207 — Data-Driven Decision Making |
| Assessment | QUM3 — Task 1: Linear Regression Analysis |
| Format | Performance Assessment — regression analysis + written report |
| Software | Excel (Data Analysis ToolPak) strongly recommended for full functionality |
| Rubric aspects | 11 scored components across sections A through F |
| Submission check | Automatic similarity scan and Grammarly for Education review before evaluation |
C207 QUM3 Task 1: Linear Regression Analysis
Data-Driven Decision Making — C207 PRFA — QUM3
Introduction
Managers are required to organize, interpret, and display data that is reliable and relevant to the real-world decisions they must make in their businesses. The use of analytical tools will improve your ability to use data to make these informed decisions.
In this task, you will address the business situation in the attached “Linear Regression Analysis Resources” scenario. You will access the scenario and dataset by entering your student ID number in the “Start” tab of the attachment, then continuing to the “Scenario” tab. Using this data set, you will perform a linear regression analysis and write a report in which you recommend a solution by summarizing the key details of your analysis.
For full functionality of the scenario and dataset attachment, you are strongly encouraged to use Microsoft Excel, which is available via the Microsoft Office 365 subscription service provided to all WGU students. It can be downloaded using the “Microsoft Office 365” link in the Web Links section.
Scenario
Refer to the scenario located in the attached “Linear Regression Analysis Resources.”
You must use the rubric to direct the creation of your submission because it provides detailed criteria that will be used to evaluate your work. Each requirement below may be evaluated by more than one rubric aspect. The rubric aspect titles may contain hyperlinks to relevant portions of the course.
Complete your linear regression analysis and create a report by doing the following:
Note: The supporting document “Linear Regression Analysis Resources” contains a scenario, data set, and data analysis template. While you must use the scenario and data set provided in the supporting document, the template is optional. You are encouraged to use the template to complete your analysis. Please see supporting document, “QUM Task 1 Getting Started,” for help accessing the scenario and dataset.
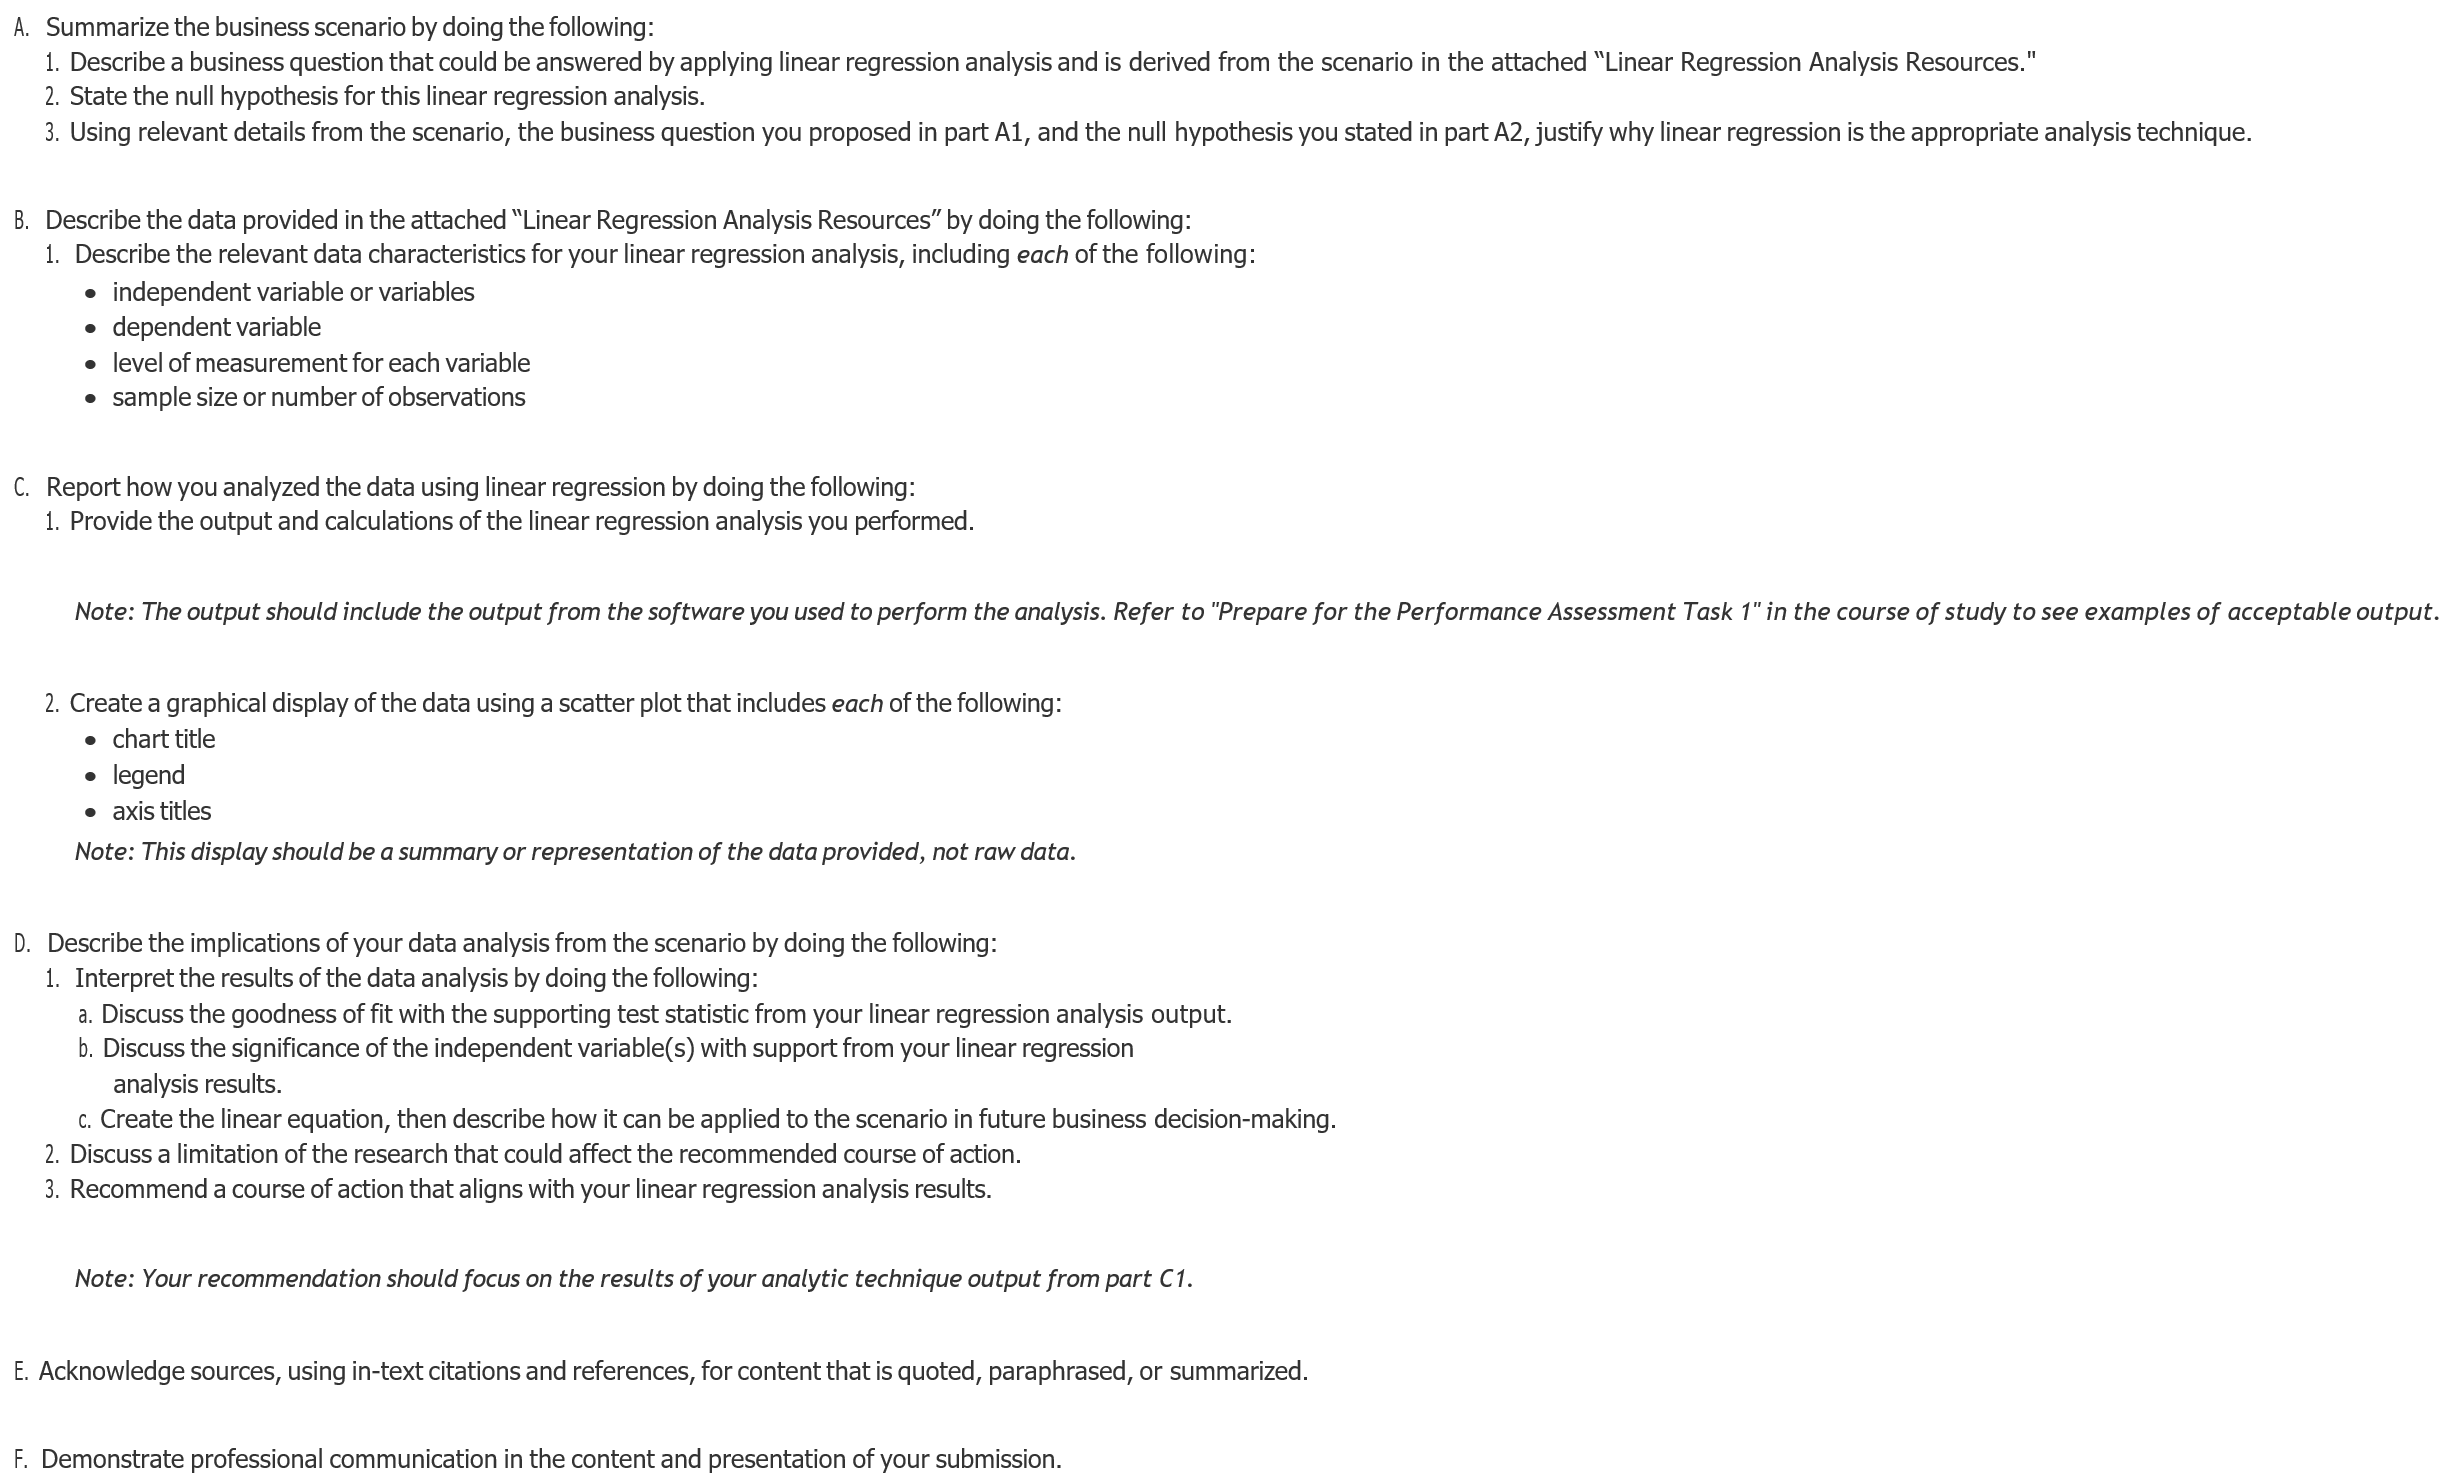
C207 QUM3 Task 1 Example
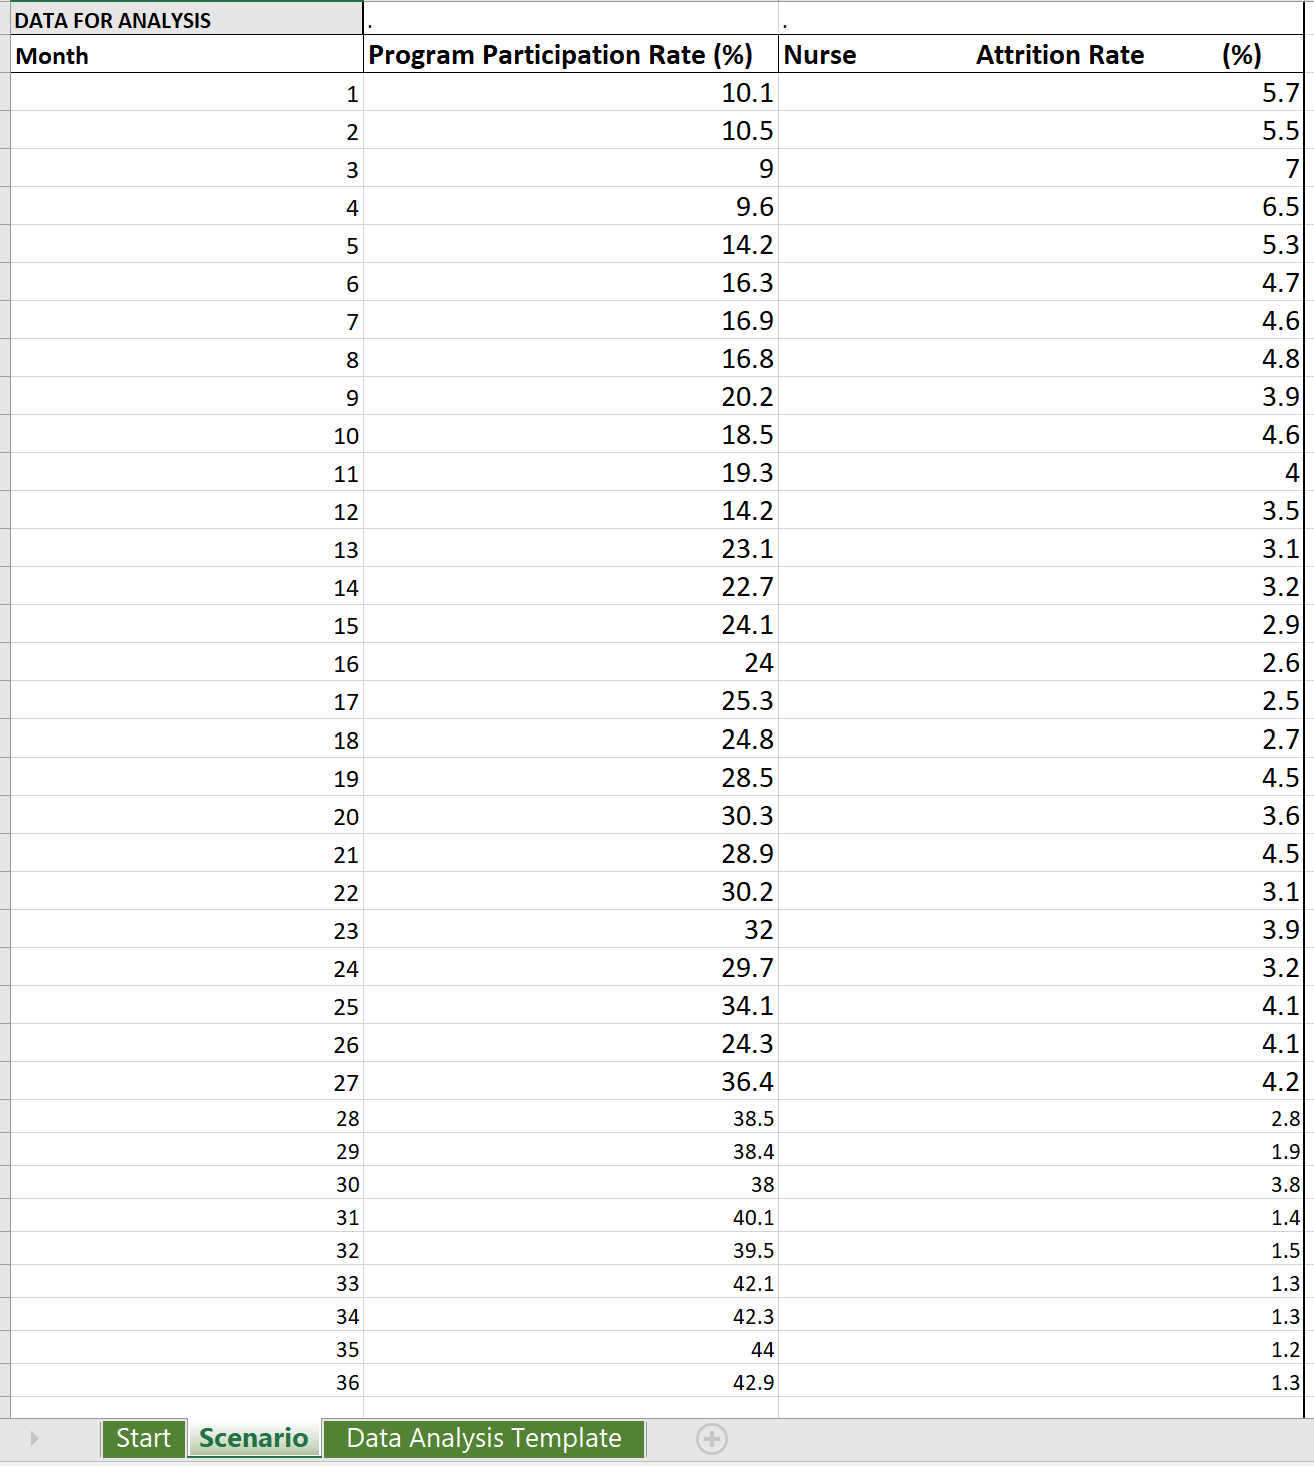
Senario
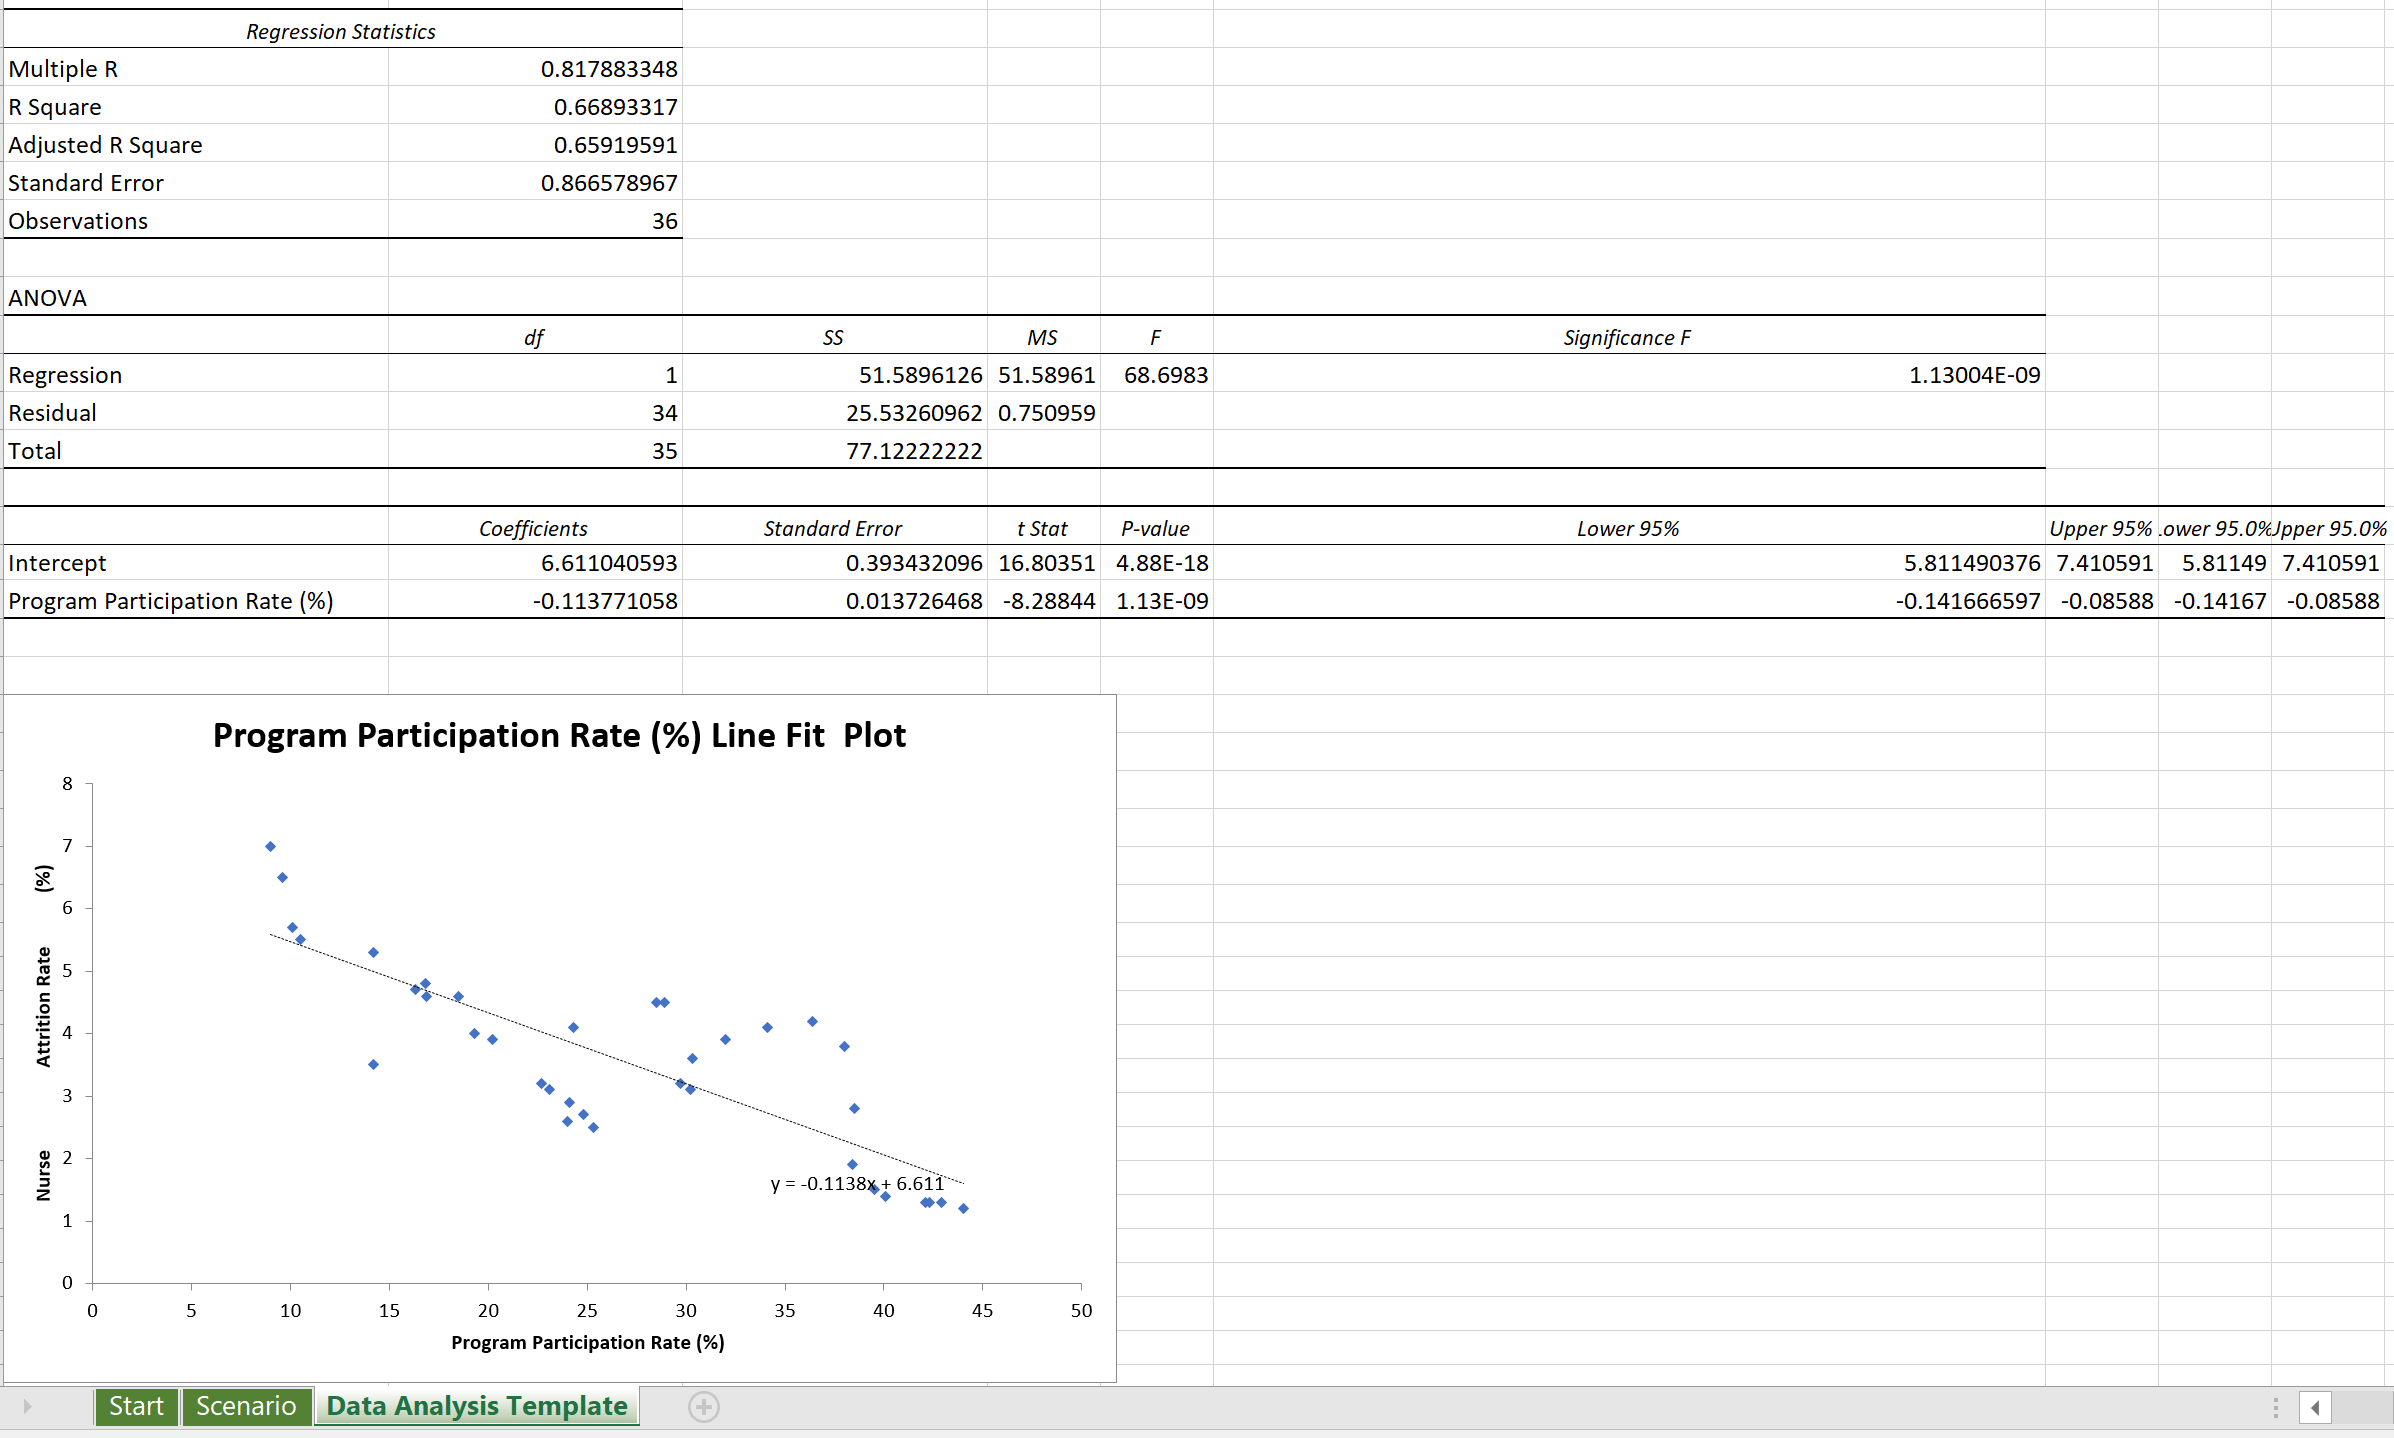
Summary Output
Interpretation of Findings
Section D
D1a. Goodness of Fit
The linear regression model shows a strong goodness-of-fit, with an R² value of approximately 0.67. In context, this means that close to 67% of the variation in nurse attrition is explained by the program participation rate, indicating that program participation implicitly accounts for the variation in nurse attrition.
D1b. Significance of the Independent Variable
The regression results show that the independent variable, program participation rate, is highly significant in predicting nurse attrition rates. The p‑value (1.13 × 10⁻⁹) is way below the significance level of 0.05, indicating a statistically meaningful relationship. Likewise, the negative coefficient (‑0.1138) shows that as participation increases, the attrition rates decrease. The model explains a substantial portion of variance, with an R² of 0.669, meaning close to 67% of the outcome is predicted by this single variable. Therefore, the results demonstrate that the independent variable is a powerful and reliable predictor of nurse attrition.
D1c. Linear Equation and Application
Predicted attrition rate is -0.1138x + 6.611 (participation rate). The slope which is –0.1138 means that for every 1‑percentage‑point increase in program participation, there is a 0.1138 decrease in percentage points. The intercept of 6.6110, which is a constant, depicts the estimated attrition rate when participation is zero.
D3. Recommended Course of Action
The results from the linear regression analysis indicate that the hospital should continue to have a program for employee wellness, and specifically increase the participation of nurses in the program. The findings show that participation rate is an important factor that determines nurse attrition, with a higher participation being significantly associated with the lower nurse attrition. For hospital leaders, the extent of the impact of participation is sufficient to feel assured that it plays a significant role in the model, which accounts for about 67% of the variance in attrition, and therefore they can focus on strategies to improve participation.
The hospital can achieve less nurse attrition, higher retention and subsequently lower costs for staffing through targeted interventions like enhanced outreach, incentives, flexible scheduling and additional program options.

Common Mistakes to Avoid
- Writing a business question that’s interesting but not specifically answerable by linear regression
- Reporting R² without any interpretation of what it actually means for the business
- Treating a non-significant p-value as proof of “no relationship” rather than “not enough evidence in this data”
- A D1c equation explanation that restates the numbers instead of applying them to a future scenario
- Skipping the correlation-vs-causation limitation in favor of a vaguer, less defensible one
- Submitting before reviewing the Grammarly for Education feedback
Perfect-Score Self-Check
- Does my business question name both variables and fit the “does X predict Y” shape?
- Is my null hypothesis specifically about the regression slope, not a generic statistical statement?
- Have I included all four data-description elements in B1?
- Does my C1 output include the full table, not just the final numbers?
- Is my C2 chart actually a scatter plot with all three required elements?
- Did I compare my p-value to my stated significance level explicitly in D1b?
- Does my D3 recommendation reference my specific analysis results, not just general advice?
- Have I cleared the Grammarly for Education check?
References & Further Reading
- Qi, J. (2023). How Much Should We Trust R2 and Adjusted R2: Evidence from Regressions in Top Economics Journals and Monte Carlo Simulations. Journal of Applied Economics, 26(1), Article 2207326. — A recent peer-reviewed paper demonstrating that R² and adjusted R² can overstate a model’s true explanatory power, directly relevant to how you should frame a goodness-of-fit discussion.
- Gershman, S. J., & Ullman, T. D. (2023). Causal Implicatures from Correlational Statements. PLOS ONE, 18(5), e0286067. — A peer-reviewed study showing that people default to reading correlational findings as causal, even when the language is carefully hedged — the exact trap this guide’s limitation section is built to help you avoid.
- Manda, P. R., et al. (2023). Misinterpretations of Significance Testing Results Near the P-Value Threshold. Cureus. — A recent peer-reviewed audit of how often researchers misreport statistical significance near the threshold; the underlying statistical literacy issue applies just as much to business analytics as to the clinical research context it examines.
Related Resource
- WGU C207 Task 2 Guide: How to Nail Every Rubric Line on Your Decision Tree Analysis
- EHM2 C206 Task 2 (Paradigm Toys): Competent Example and Guide
- WGU D472 Task 1 Guide: Operations and Supply Chain Disruption Presentation
- WGU D473 Task 1 Guide: How to Identify Root Cause Variables Using Data Analysis
- WGU D361 Task 1: Business Performance Report (Marketplace Simulation)
Frequently Asked Questions
- Is the hospital/nurse wellness scenario used in this guide’s examples? No. Every C207 QUM3 Task 1 student receives the same scenario and one of three shared datasets, so this guide uses a fictitious retail scenario (Ferngate Retail Group) to demonstrate the method without answering the actual shared prompt.
- Does this guide give me the answers to my specific dataset? No — and it can’t, since your dataset is one of three assigned by your student ID and not visible to us. What this guide gives you is the exact rubric-by-rubric method, demonstrated on fictitious numbers, so you can apply the same process to your real output.
- What software should I use for the regression analysis? Excel with the Data Analysis ToolPak add-in is what WGU recommends and what this guide’s walkthrough assumes. If the ToolPak isn’t visible in your Data tab, it needs to be enabled through Excel’s Add-ins settings first.
- Is getting help with this task against WGU’s academic integrity policy? Tutoring, coaching, and editing support are a normal, accepted part of studying — most university policies explicitly support students getting this kind of help. Our role is to help you understand and interpret your own output, which fits well within that.