
WGU D473 Guide and Example: Solutions Design and Visualization Capstone


Updated on: Aug 14, 2026
WGU D473 is the Solutions Design and Visualization Capstone, the course where the operations and supply chain work you did earlier in the MBA program gets turned into a full, evidence-based business case. Students searching wgu 473 are usually looking for the same thing: a plain explanation of what the capstone actually asks for, in what order, and how much of it depends on the course that comes right before it.
This guide walks through the D473 capstone WGU structure end to end, using the Endothon Case Study that anchors the course as the running example, so a busy working student can see how the pieces (root cause analysis, proposed solutions, and a control plan) fit together before opening the workbook.
D473 Task 1 Assignment
Endothon Supply Chain Network Redesign
Endothon is a prominent manufacturer of silicone caulk products and supplies various options to “big-box” retailers (i.e., large establishments that offer a wide array of products). These silicone caulk products are in high demand due to their widespread usage by end-users involved in construction projects. However, the existing supply chain network has remained unchanged for the past 30 years, leading to inefficiencies and increased operational costs.
Endothon needs to improve its overall operational efficiency, reduce lead times, and eliminate unnecessary costs. To address these challenges, senior leadership has decided to initiate a full review of the current processes. Leadership and has chosen you, the operations manager, to lead the project—from the analysis of the data collection to the implementation of key performance indicators.
Your leadership team has collaborated with cross-functional teams, continual improvement experts, and outside consultants to identify potential opportunities and challenges in the execution of this project. A comprehensive data file, titled “Endothon Data File,” has been developed for you as a foundation from which you will begin your analysis.
You will gain background information about the case using the “Endothon Case Study” supporting document. You will analyze the collected data in the “Endothon Data File” supporting document and provide your responses to part A of this task using the “Endothon Data Analysis File” supporting document. You will then create a presentation in part B of this task to synthesize and justify your findings.
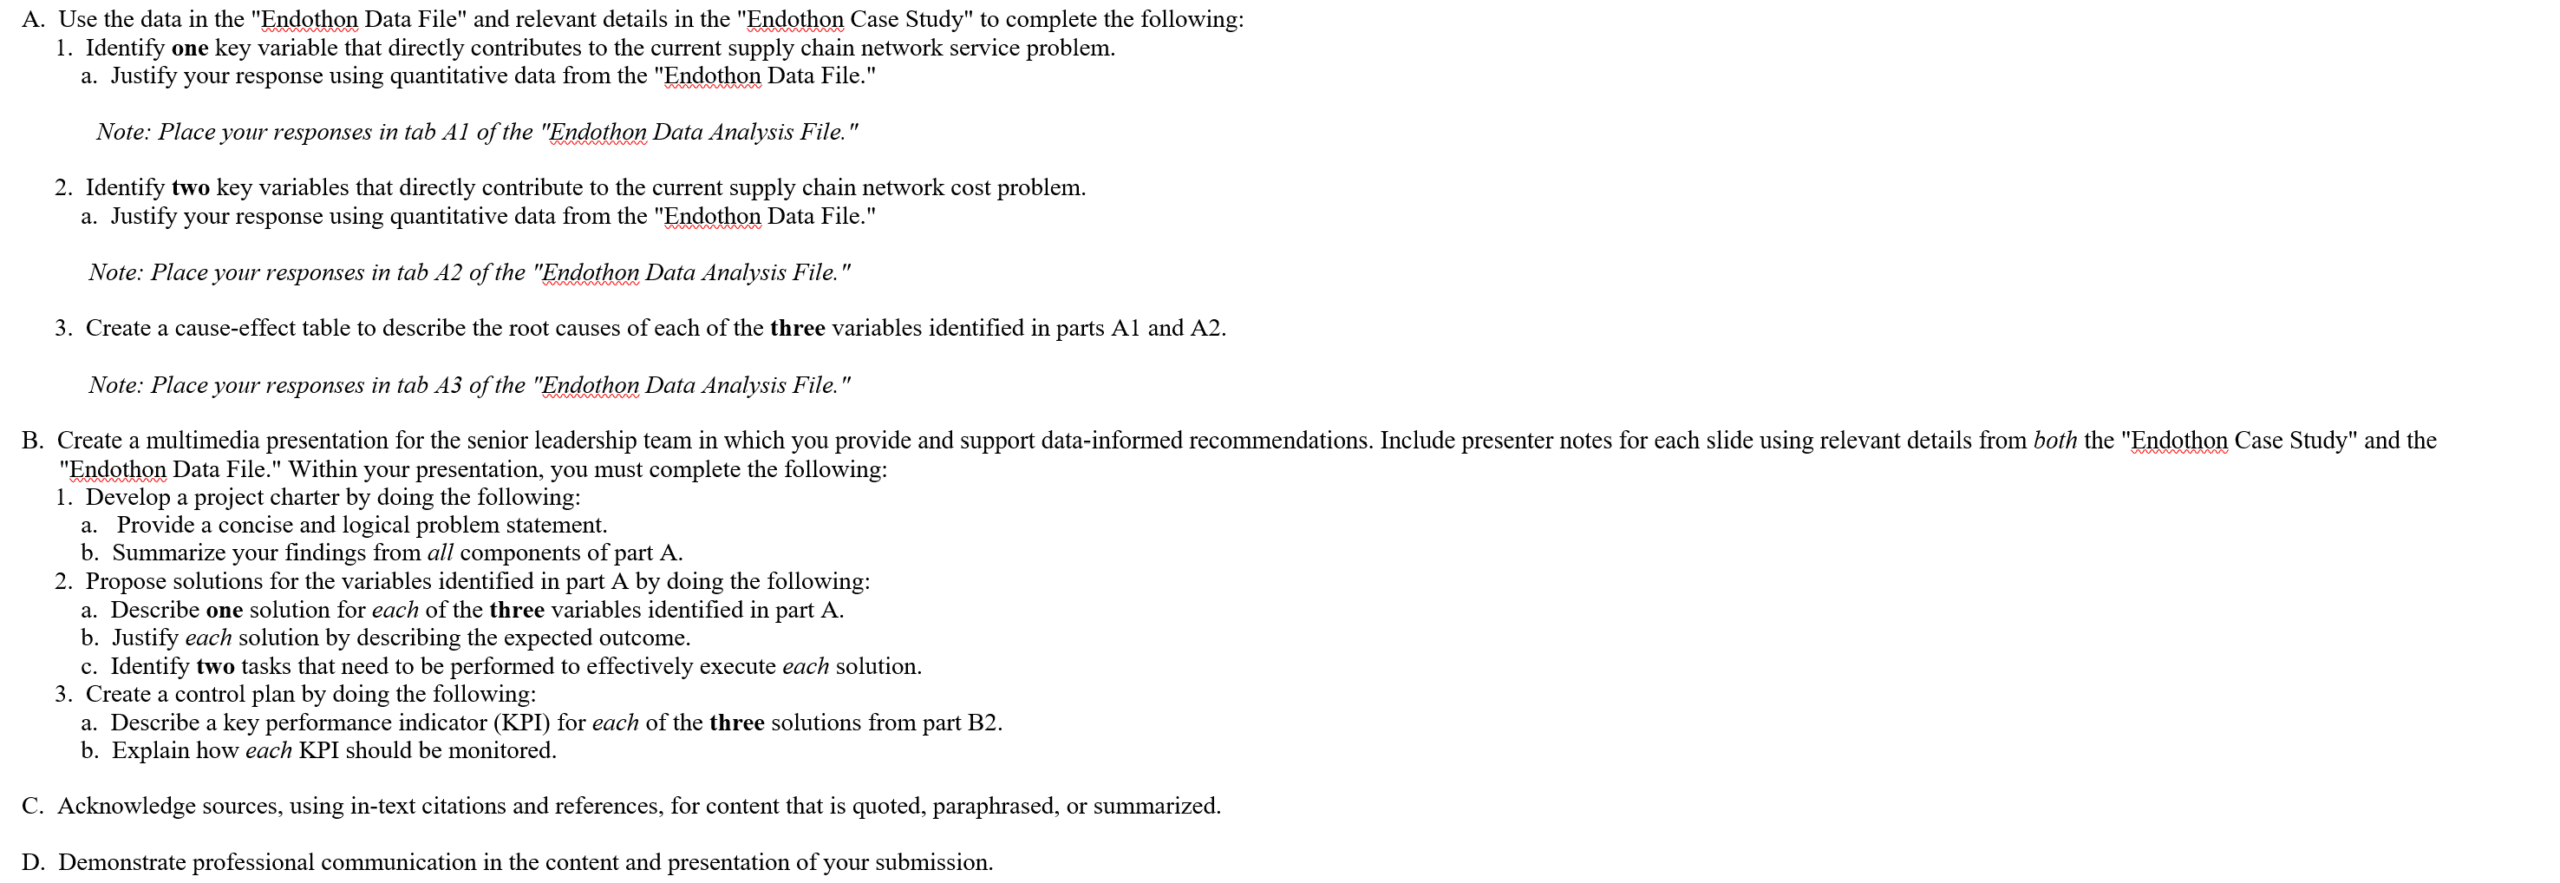
D473 Task 1 Case Study – Endothon Case Study
D473 Task 1 Example
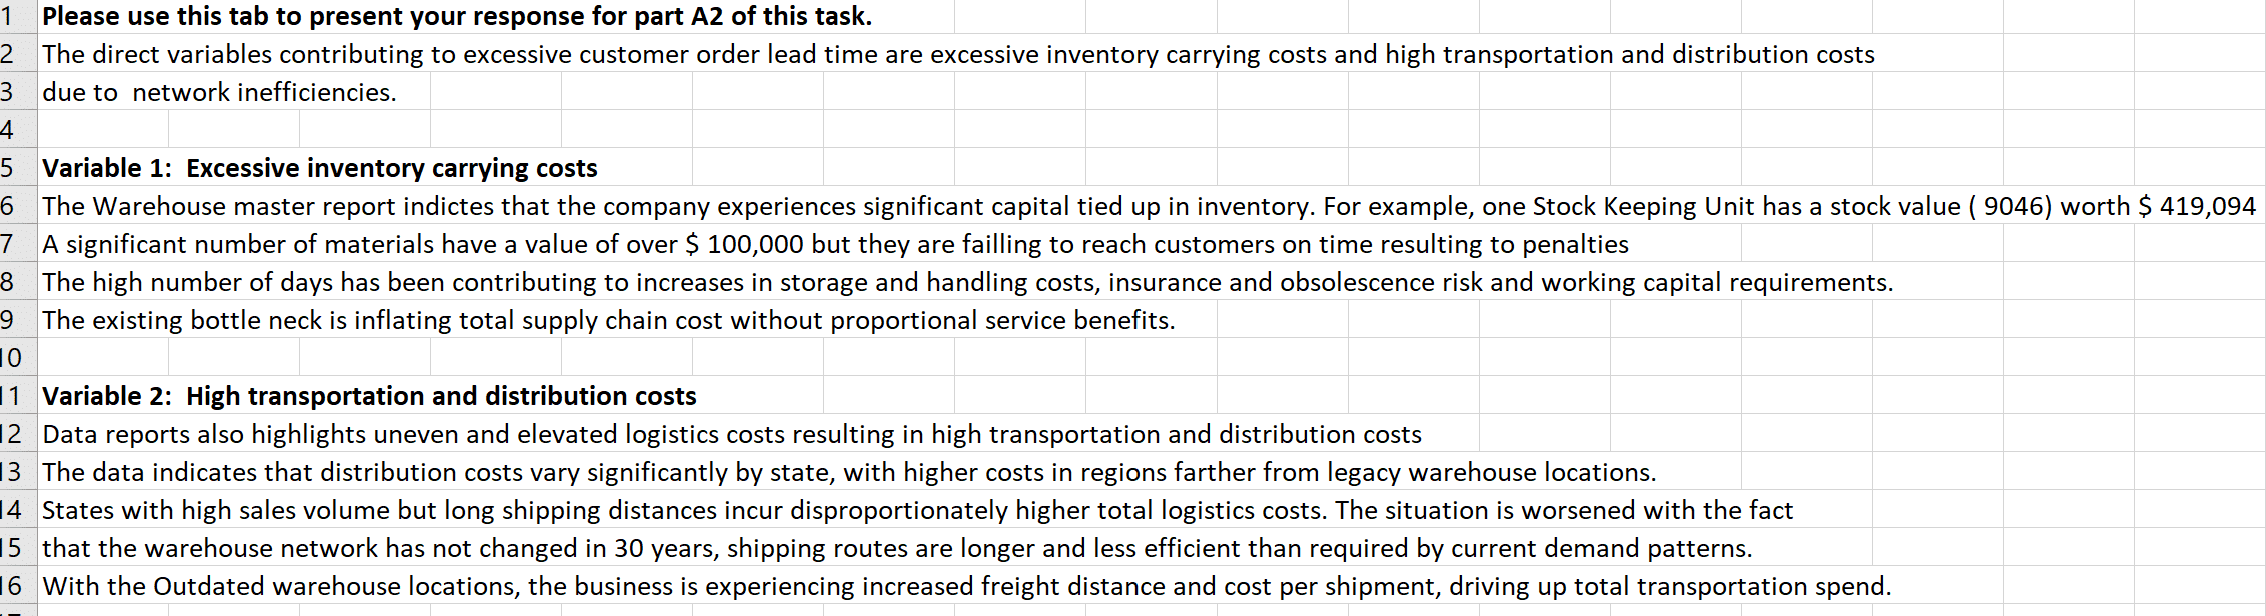
A2a
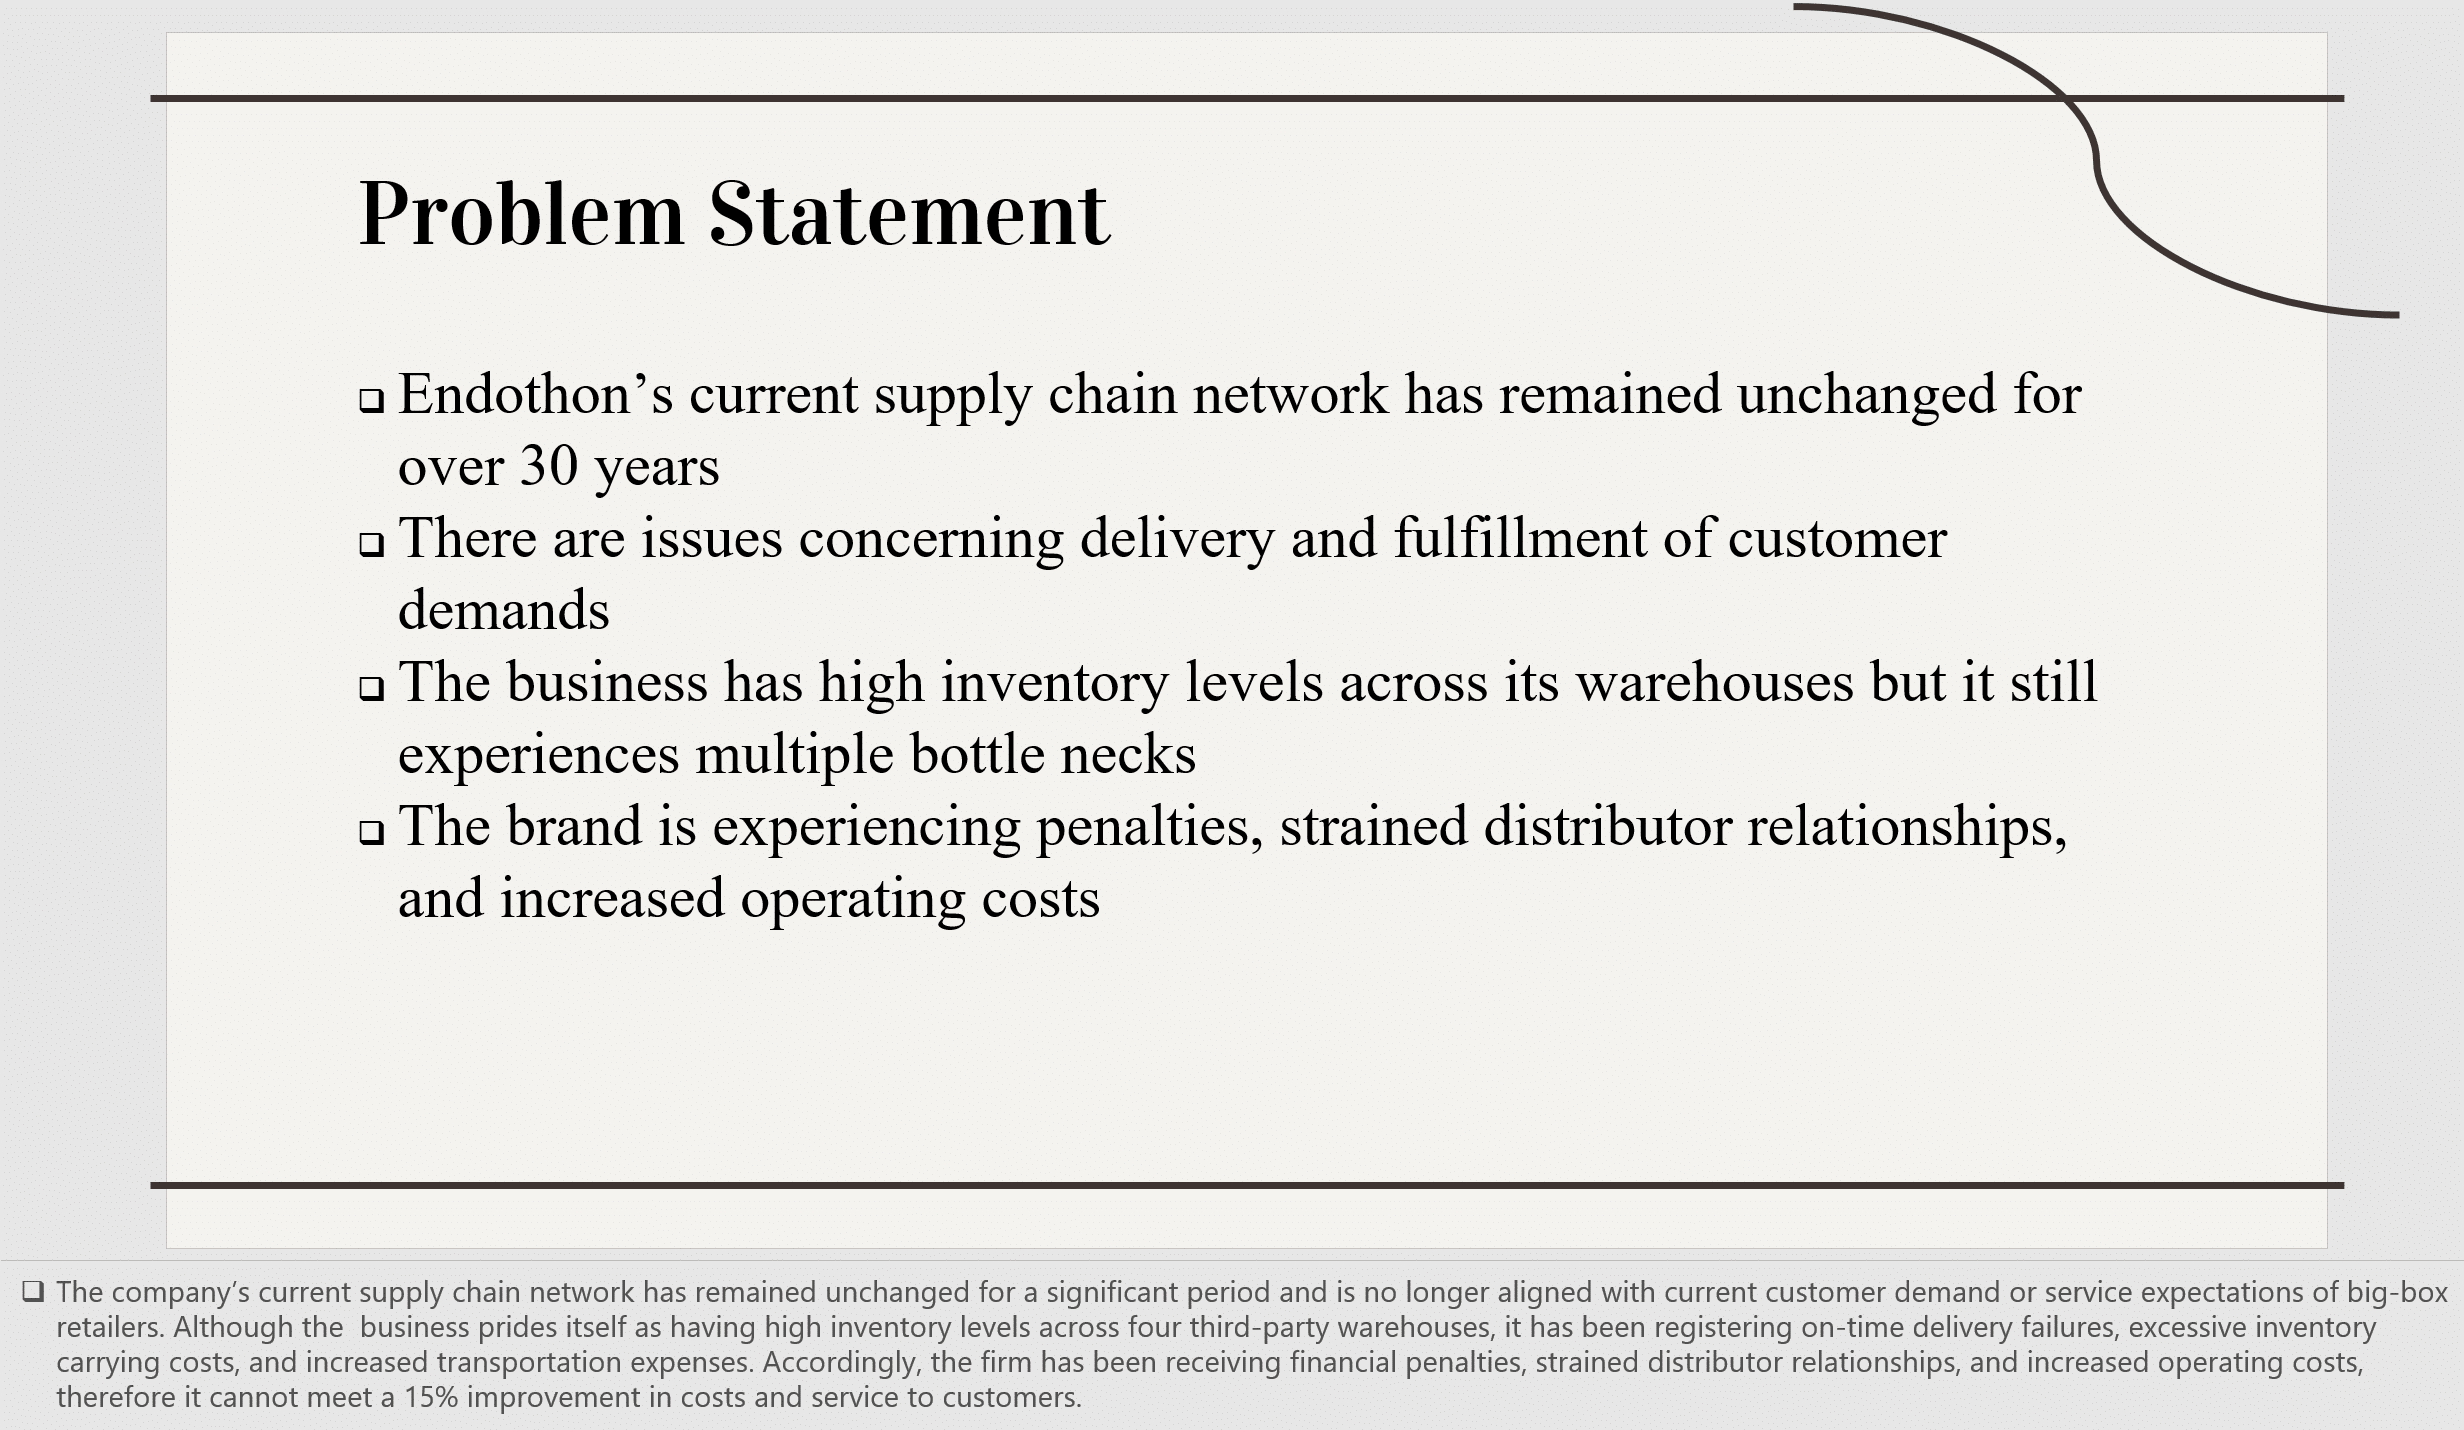
B1a
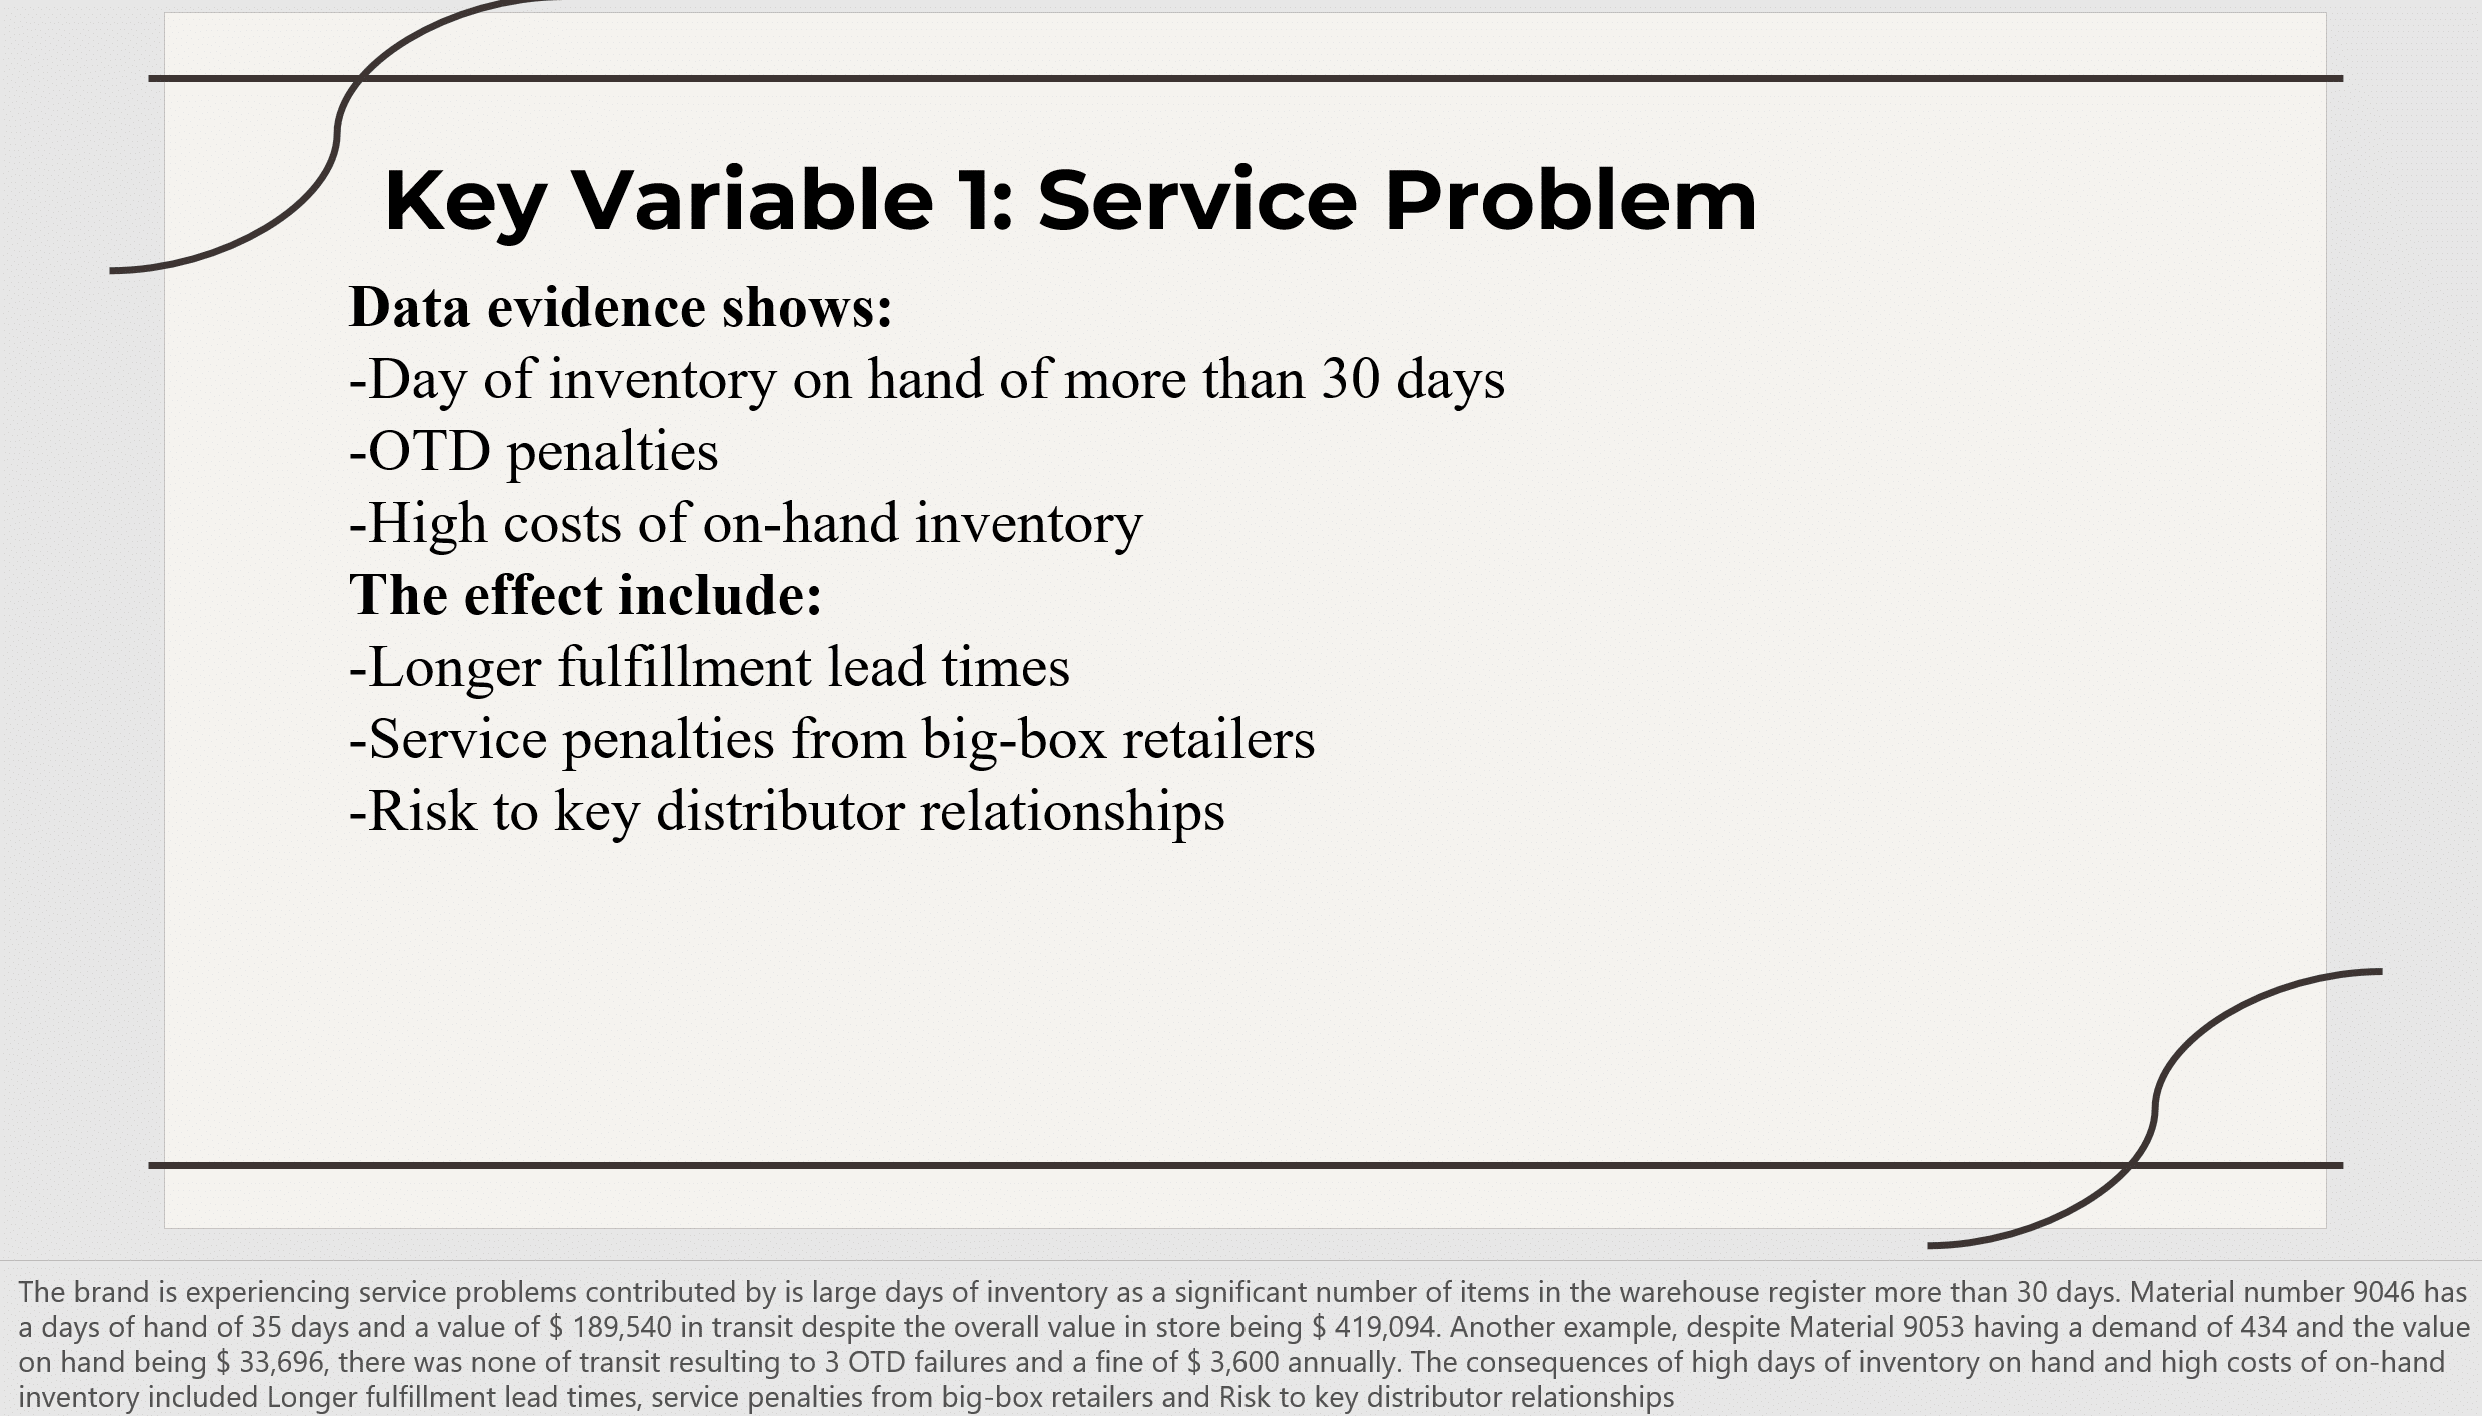
B2a
Where D473 Fits in the MBA Sequence
D473 doesn’t stand alone. Most students land here right after WGU D472, the operations and supply chain course, and the capstone leans on that foundation directly: the same kind of Supply Chain Network thinking, the same habit of separating what a company controls from what it doesn’t. If you’re comparing notes with classmates, WGU D472 Reddit threads and WGU D473 Reddit threads tend to cover overlapping ground for exactly this reason, students working through both courses back to back and asking the same “how much detail does the rubric actually want” questions.
Some students also research WGU D471 Reddit discussions while planning their term, since D471 frequently sits nearby in course-sequencing conversations. If you’re building out a WGU capstone archive of notes and examples for your own study reference (or looking for a public one), it’s worth collecting D471, D472, and D473 material together, since the analytical habits carry across all three.
D473 Task 1: Root Cause Analysis
D473 Task 1 is where the diagnostic work happens. You’re given operational data and asked to identify the key variables contributing to Endothon’s service and cost problems, trace them back to root causes, and support every claim with quantitative data rather than assumption.
A Repeatable Process for the Data
This sequence works on any operations-analysis workbook, not just Endothon’s:
- Understand every worksheet. Skim each tab before analyzing anything, so you know what data exists before deciding what’s relevant.
- Identify available variables. List every measurable field: delivery times, order volumes, costs by category, location, dates.
- Calculate descriptive statistics. Averages, ranges, and totals per category reveal patterns a single number can’t.
- Look for unusual values. Outliers often point directly at the source of a problem.
- Compare across locations or categories. If one facility, region, or product line looks different from the rest, that’s a lead worth chasing.
- Identify trends over time. A problem that’s worsening month over month tells a different story than one that’s been constant.
- Validate your conclusion. Before finalizing, ask whether the data could support a different explanation. A defensible answer survives that question.
A few questions worth asking of the data at every stage: which metric changed the most, is the change consistent over time, does the pattern show up across multiple locations, and could a different variable explain the same outcome just as well.

Understanding Variables
Task 1 expects you to work with these distinctions cleanly:
- Independent variable: the factor you believe is driving the outcome (for example, distance from the distribution hub)
- Dependent variable: the outcome being affected (delivery time)
- Operational metric: measures of process performance (throughput, cycle time)
- Service metric: measures of customer-facing outcomes (on-time delivery rate, fulfillment accuracy)
- Cost metric: measures of financial impact (transportation cost per unit, inventory holding cost)
Identifying the Service Problem
Rather than scanning for “the answer,” ask targeted questions of the data: which variable correlates most consistently with longer customer wait times, which variable shows the widest gap between best and worst-performing locations, and which variable, if it changed, would most plausibly move the service metric.
Identifying the Cost Problem
Cost drivers worth checking systematically in any supply chain analysis include transportation (fuel, freight, distance), inventory (holding costs, stockouts, overstock), warehousing (facility costs, utilization), labor (overtime, staffing levels), packaging, and order frequency or batch size.
A cause-effect table is the clearest way to present this: each identified variable listed alongside the specific evidence tying it to the service or cost problem, so the connection between data and conclusion is visible at a glance rather than buried in narrative text.
D473 Task 2: From Diagnosis to Solutions
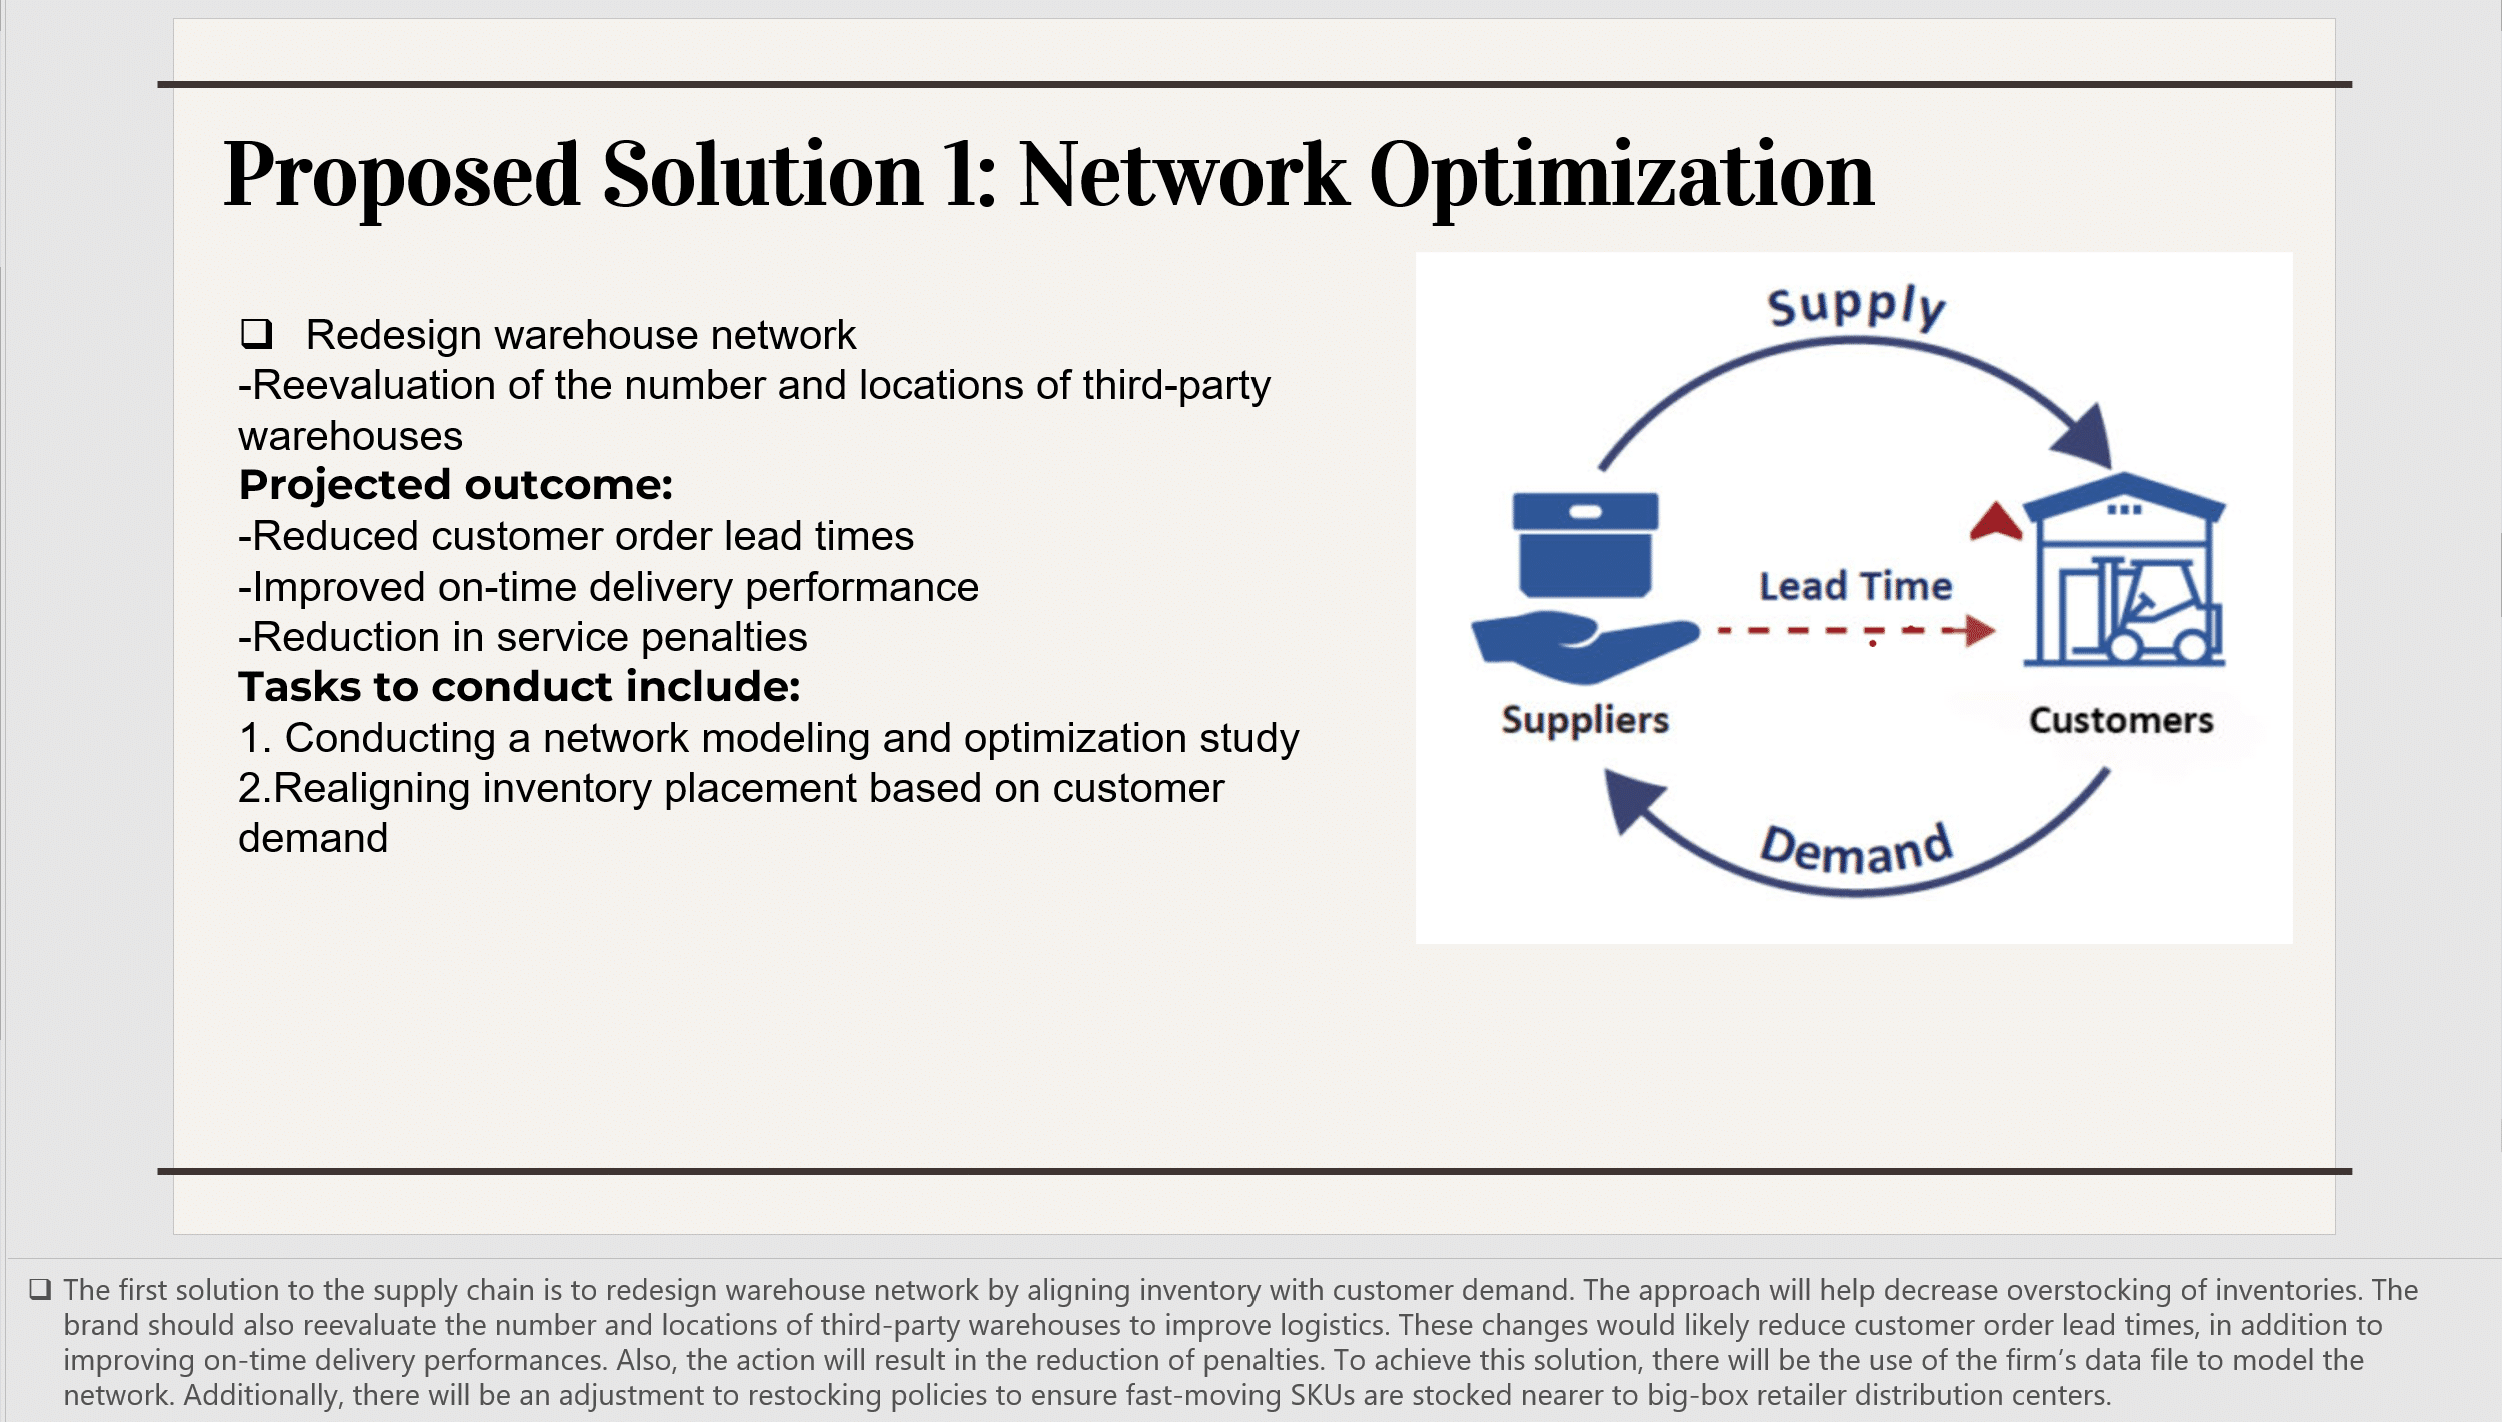
Once Task 1 establishes what’s actually driving Endothon’s problems, Task 2 shifts from diagnosis to supply chain optimization. This is where you propose concrete solutions, tied directly back to the root causes you identified rather than introduced fresh.
A strong Task 2 submission typically covers:
- Solutions: specific, actionable changes addressing the root causes from Task 1, not generic best practices
- Expected outcomes: what measurably improves if each solution is implemented, framed against the current baseline
- Cost reduction: where the financial benefit comes from and how it’s estimated
- Implementation tasks: the concrete steps required to execute the recommendation, in a logical sequence
- Project charter: the document framing scope, objectives, and stakeholders for the proposed work
- KPI selection: the specific metrics leadership would track to know whether the solution is working
- Control plan: how the organization keeps the improvement from drifting back to the old baseline once implemented
All of this gets synthesized into a multimedia presentation, and the same discipline that matters in D472’s capstone-adjacent presentations applies here: keep the visible slide clean, and put the real analytical depth in the presenter notes. A slide that just restates a KPI name isn’t doing the work; the notes are where you explain why that KPI was chosen and what threshold would trigger a response.
Common Mistakes to Avoid
- Using opinions or assumptions instead of data pulled directly from the workbook
- Confusing a symptom (late deliveries) with a root cause (network design)
- Choosing a variable that’s interesting but not clearly tied to the specific problem, service or cost
- Weak or missing quantitative justification; a claim without a number attached won’t hold up
- Proposing solutions in Task 2 that don’t trace back cleanly to the root causes established in Task 1
- Selecting KPIs that sound reasonable but don’t actually measure the outcome the solution is meant to produce
Key Takeaways
Before considering the capstone complete, make sure you can:
- Explain why your chosen variables influence the business problem
- Support every conclusion with quantitative evidence
- Distinguish symptoms from underlying causes
- Show a clear line from root cause, to solution, to expected outcome, to KPI
- Communicate recommendations as if presenting to senior leadership
Successful managers don’t simply identify problems. They explain why those problems exist and recommend practical solutions supported by evidence, which is the exact skill D473 is built to test.
Frequently Asked Questions
- Is there a WGU D473 review worth reading before starting? Most WGU D473 review discussions from students land on the same point: the course is manageable if you treat Task 1’s data analysis seriously before touching the presentation, since a shaky root cause analysis makes Task 2 much harder to write convincingly.
- What do students say on D473 WGU Reddit threads? The recurring theme on D473 WGU Reddit threads mirrors the official guidance: don’t skip straight to proposing solutions. Students who struggle tend to jump to Task 2 without fully mining the Endothon data file first.
- Is this course similar to the WGU supply chain management capstone Reddit discussions I’ve seen? Searches for WGU supply chain management capstone Reddit often lead students to D473 threads, since the course functions as the practical capstone for the supply chain and operations sequence that includes D472.
- Is getting help with this task against WGU’s academic integrity policy? Tutoring, coaching, and editing support are a normal, accepted part of studying. Most university policies explicitly support students getting this kind of help.
Related Content
D361 Cumulative Balance Scorecard Explained: What It Measures and How to Write About It
D361 Business Overview: How to Write Section C1 of Your Business Performance Report
WGU C210 Task 1 Guide: MSML Capstone (Annotated Bibliography)
WGU C210 Task 3 Guide: Management and Leadership Development Program Presentation (MKM1)
WGU C210 Task 2 Guide: Management and Leadership Development Program (MKM1)
References & Further Reading
- ASQ (American Society for Quality); the Fishbone (Ishikawa) Diagram overview and root cause analysis and problem-solving resources explain the origins and structured use of cause-and-effect analysis referenced above.
- ASCM (Association for Supply Chain Management); their supply chain management overview is a widely cited industry source for the supply chain terminology used in this guide.
- CSCMP (Council of Supply Chain Management Professionals); maintains a glossary of standard supply chain and logistics definitions, useful for cross-checking terminology.
- PMI (Project Management Institute); the authoritative body behind the PMBOK Guide, whose project charter guidance informs the project charter and KPI components covered above.