
C219 Task 1 Example and Guide: MBA Capstone Investor Presentation


C219 Task 1 Example and Guide
C219 Task 1 asks you to step out of the “write a paper” mindset and into the “pitch to investors” mindset. You’re not writing an academic essay: you’re building a presentation that uses your simulation results from Q1–Q4 to convince venture capitalists to hand over $2.5 million. The task also requires you to have your tactical plan projected out through Q6 before you even start, and the official instructions are specific about the order you complete things in. Follow that sequence: don’t try to reorder it to fit your schedule.
KAM4 C219 TASK
1: Investor Presentation
MBA, Healthcare
Management Capstone C219 PRFA KAM4
Competencies
981.1.8: Integration of Program Competencies
The graduate
demonstrates the ability
to participate and contribute value
to the professional field through the integration of competencies
from across the degree program.
Introduction
An important aspect of running
a successful start-up
business is acquiring funding from potential investors based on information about the business. In this task,
you will use the skills
you have acquired
in the MBA coursework to complete the start-up phase
in a business simulation. The
simulation is accessed through your
course. Using data from the Q1 Q4 phase
of the simulation, you will create and deliver a presentation for potential business investors using the attached
Presentation Template PowerPoint slide deck and information from the scenario.
The objective of the presentation is to obtain capital to grow your business.
Before you begin working
on Task 1, you must finish and submit the simulation up to the end of the third quarter (Q3). Begin working
through the fourth
quarter (Q4) and load the data from the simulation into the tactical plan.
Next, manually fill out your projections for the fifth
(Q5) and sixth
quarters (Q6) within
the tactical plan, ensuring
the tactical plan is fully
updated through Q6 before beginning this task.
Submit Task 1 concurrently with submitting your decisions for Q4 within
the simulation. When you have passed Task 1, submit
Q4 again and you will be allowed
to proceed with the simulation into Q5.
Scenario
You
are the owner of a start-up business
that creates 3D-printed, carbon fiber bicycles.
Up through the business s third quarter (Q3),
you have used your own money to fund the business. The business model
shows promise, but you are now seeking an additional $2.5 million in equity funding
to execute your business plan. You will create and deliver a multimedia presentation that shows your business plan to potential investors and illustrates how the additional funding will be used and will provide
a return to your investors.
Requirements
Your submission must represent your original work and understanding of the course
material. Most performance assessment submissions are automatically scanned through the WGU similarity checker
Students are strongly encouraged to wait for the similarity report to generate
after uploading their
work and then review it to ensure Academic
Authenticity guidelines are met before submitting the file for evaluation.
See Understanding Similarity Reports for more information.
Grammarly Note:
Professional
Communication will be automatically assessed through Grammarly
for Education in most performance assessments before
a student submits
work for evaluation. Students are strongly
encouraged to review the Grammarly for Education
feedback prior to submitting work for evaluation, as the overall submission will not pass without this aspect passing.
See Use Grammarly for Education Effectively for more information.
Microsoft Files Note:
Write your paper in Microsoft Word (.doc or .docx) unless another Microsoft product, or pdf, is specified in the task directions. Tasks may notbe submitted as cloud links, such as links to Google Docs, Google Slides, OneDrive, etc. All supporting documentation, such as screenshots and proof of experience, should be collected in a pdf file and submitted separately from the main file. For more information, please see Computer System and Technology Requirements.
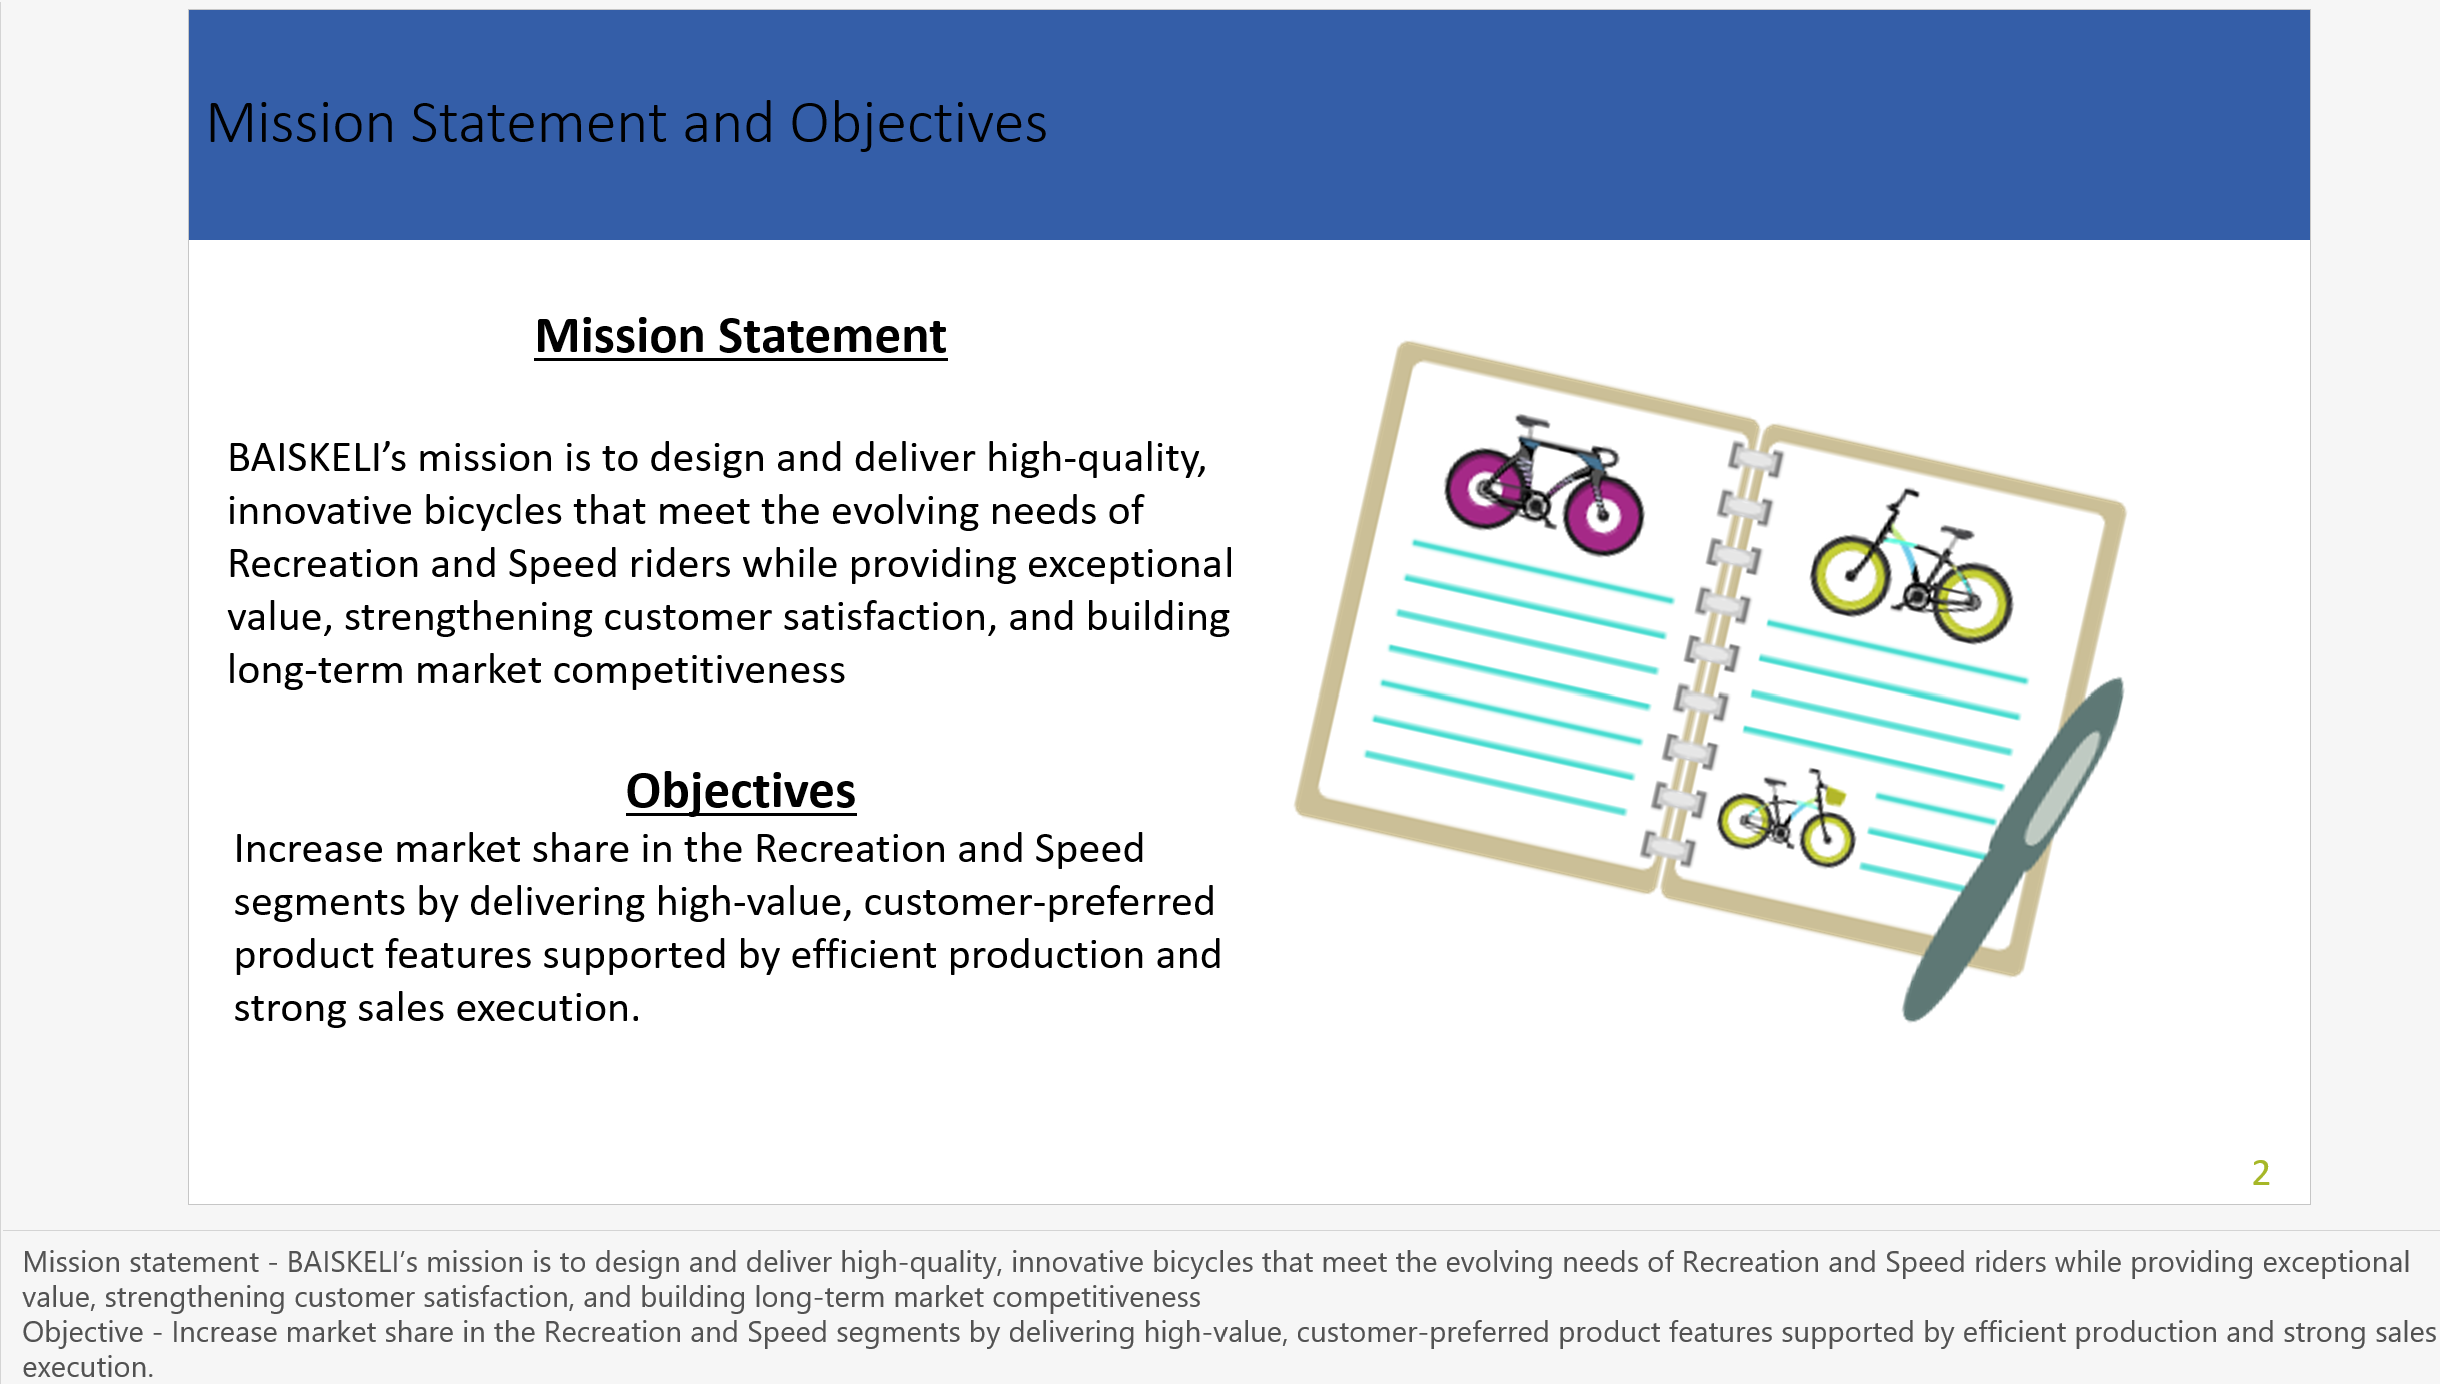
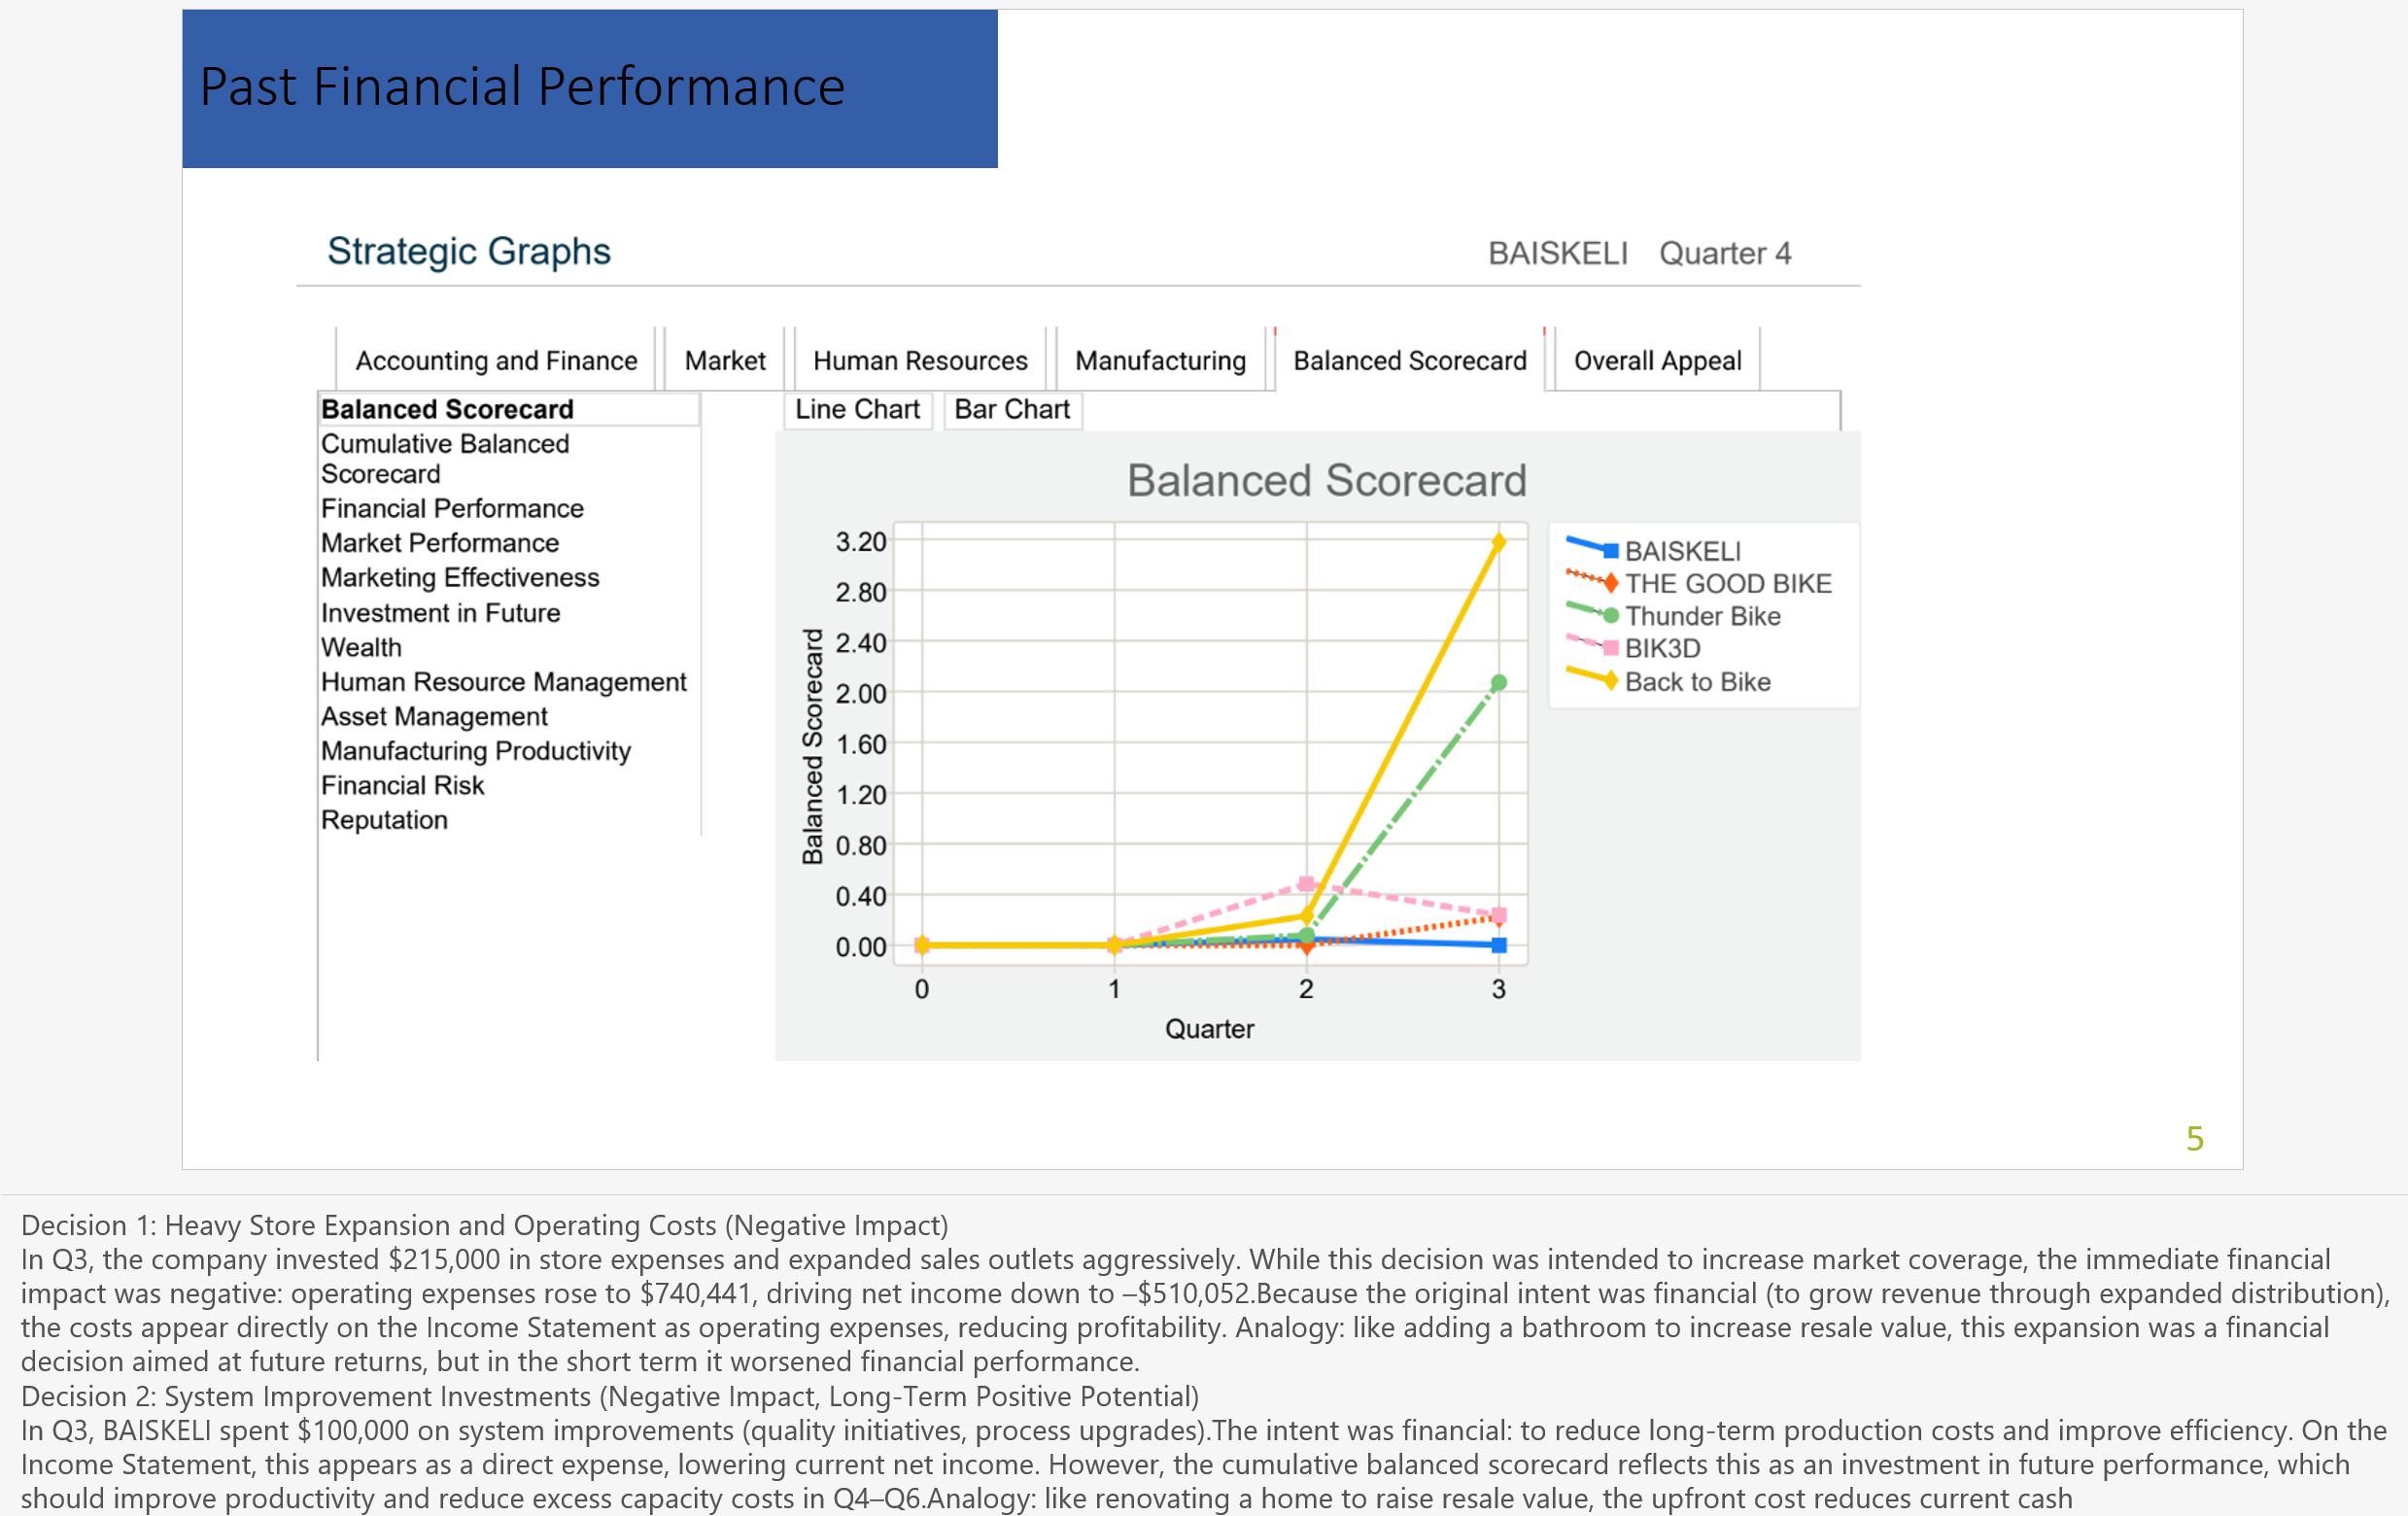
C219 Task 1 Example
Segment of the completed C219 Task 1 investor presentation attached for references purpose only. For Custom Presentation based on your simulation results, WhatsApp Us: +1 757-804-6113


C219 Task 1 at a Glance
You’re the owner of a start-up that makes 3D-printed, carbon fiber bicycles. Through Q3, you’ve self-funded the business. Now you need $2.5 million in equity funding to keep growing, and your job is to build the case using your own simulation data: what happened in Q1–Q3, where the company stands today, and what you’ll do with the money in Q4–Q6.
The presentation has to do three things at once: prove you understand why past decisions produced the results they did, show a clear-eyed SWOT analysis of where the company stands, and lay out a specific, tactical-plan-backed strategy for the next three quarters. Investors don’t fund vague optimism — they fund evidence and a plan. That’s the lens for every section below.
What You Need Before Starting C219 Task 1
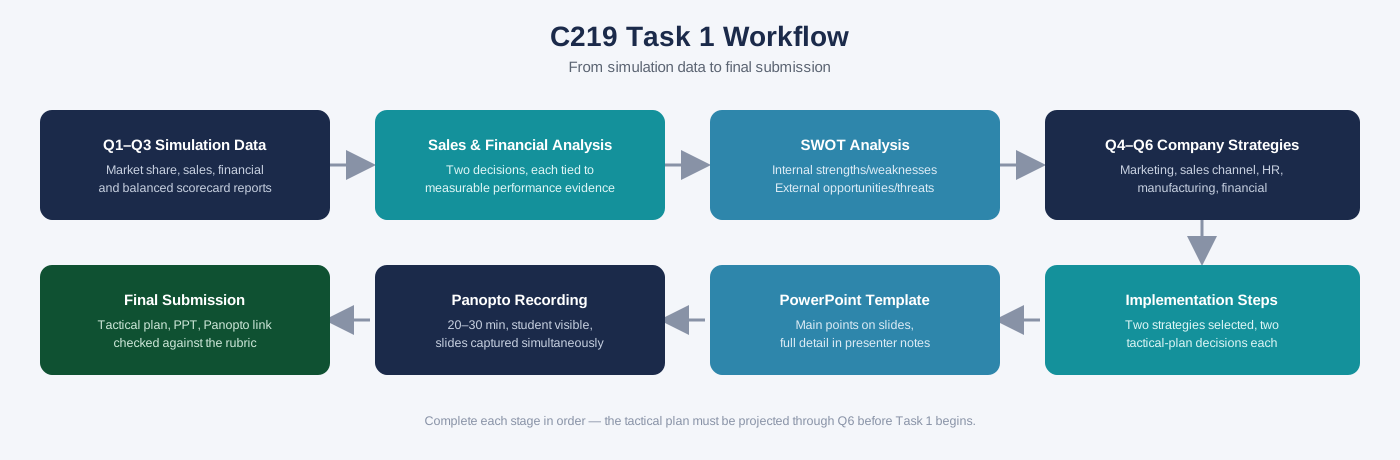
The task instructions require a specific prep sequence. Don’t skip steps or work out of order.
- Finish and submit the simulation through the end of Q3.
- Begin working through Q4 in the simulation.
- Load your Q4 results into the tactical plan.
- Manually complete your Q5 and Q6 projections inside the tactical plan.
- Confirm the tactical plan is fully updated through Q6.
- Submit Task 1 at the same time you submit your Q4 decisions in the simulation.
Once you pass Task 1, you resubmit Q4 and the simulation lets you move into Q5. If your tactical plan isn’t projected through Q6 before you start writing, stop and fix that first: most of Steps 6–8 below depend on it.
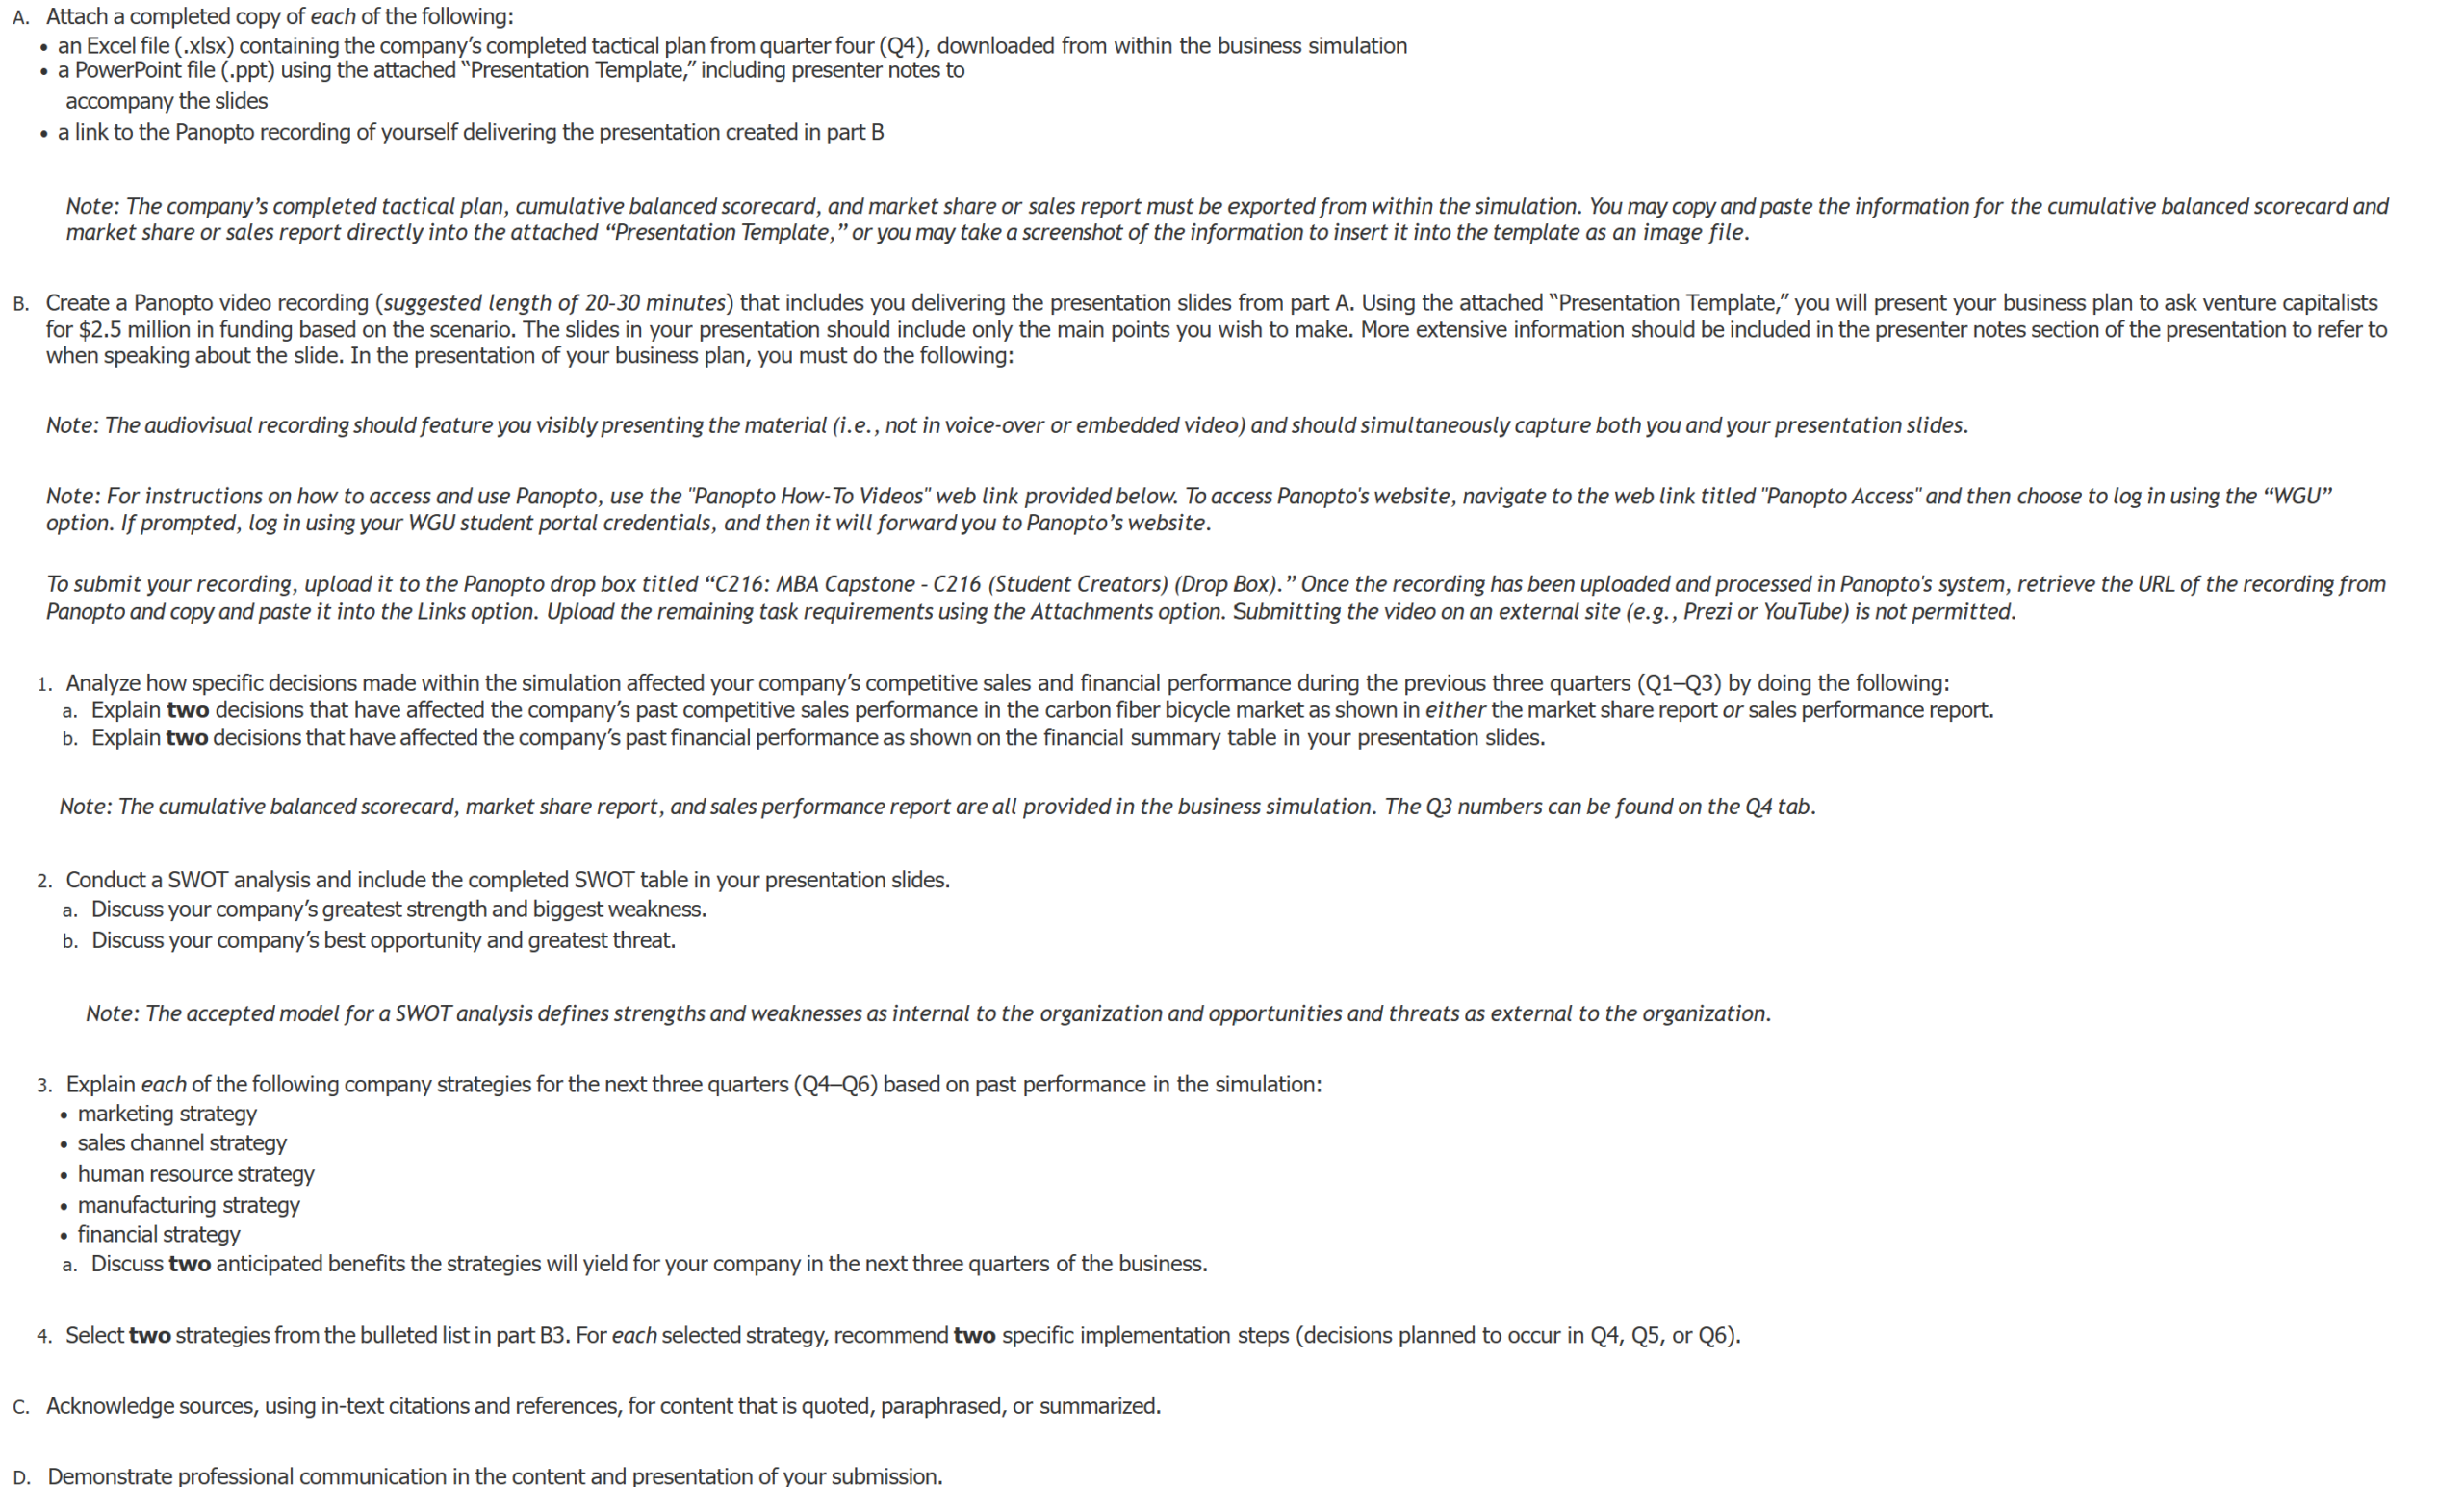
What You Have to Submit
Three components go into this submission, and each has its own formatting rules.
Completed Q4 Tactical Plan
This is the Excel (.xlsx) file downloaded directly from the simulation, reflecting your completed Q4 decisions. It’s the evidence base for your Q4–Q6 strategy and implementation steps later in the task, so it needs to be accurate and fully exported: not a partial screenshot.
PowerPoint Presentation
Use the official Presentation Template (.ppt/.pptx) supplied with the task. Two things matter here:
- Slides carry the main points only: headlines, key numbers, the SWOT table, the financial summary.
- Presenter notes carry the depth: the “why,” the evidence, the business reasoning.
Pull your market share report, sales performance report, cumulative balanced scorecard, and financial summary directly from the simulation, and either paste them in as text or insert them as screenshots.
Panopto Recording
- Suggested length: 20–30 minutes.
- You must be visibly presenting: not narrating over static slides or using an embedded video.
- The recording has to capture you and your slides at the same time.
- Upload to the required Panopto drop box, wait for it to process, then paste the URL into the Links section of your submission.
The slide-versus-notes distinction is the one thing students get wrong most often here. If your slides look like a printed report, you’ve mixed the two up.
C219 Task 1 Step-by-Step Guide
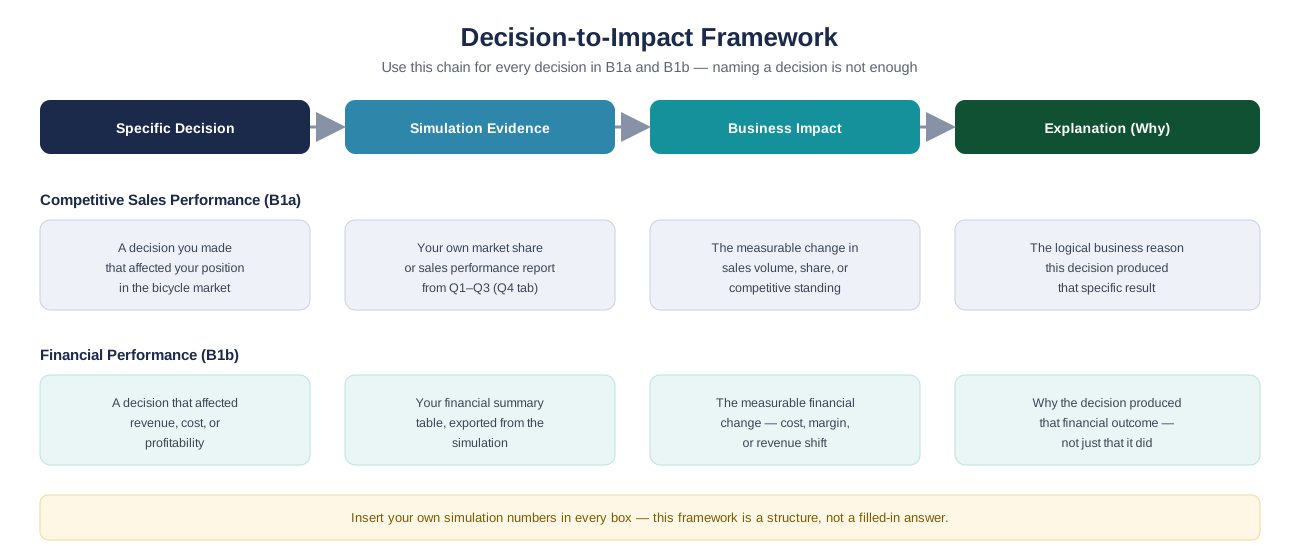
Step 1: Analyze Q1–Q3 Competitive Sales Performance (B1a)
You need two specific decisions that affected your company’s competitive sales performance, pulled from either the market share report or the sales performance report. Naming a decision isn’t enough: the evaluator wants a logical chain from decision to measurable result.
Use this structure for each of the two decisions:
Decision → Evidence → Effect on Sales/Market Share → Business Explanation
For example, in skeleton form:
“The company changed [specific decision]. The Q1–Q3 results show [actual simulation evidence]. This decision affected competitive sales performance because [logical business connection].”
Replace every bracket with your own simulation numbers. Check the Q4 tab for your Q3 figures: that’s where the cumulative balanced scorecard, market share, and sales data live.
Step 2: Analyze Q1–Q3 Financial Performance (B1b)
Same approach, different data source. You need two specific decisions tied to your financial summary table, using this structure:
Decision → Financial Evidence → Financial Impact → Why the Decision Produced That Impact
Avoid the trap of stopping at correlation. “Sales increased, so the decision was successful” isn’t an explanation: it’s a coincidence stated as fact. You need the business logic connecting the decision to the number. Don’t invent figures; pull everything directly from your financial summary.
Step 3: Complete the SWOT Analysis (B2)
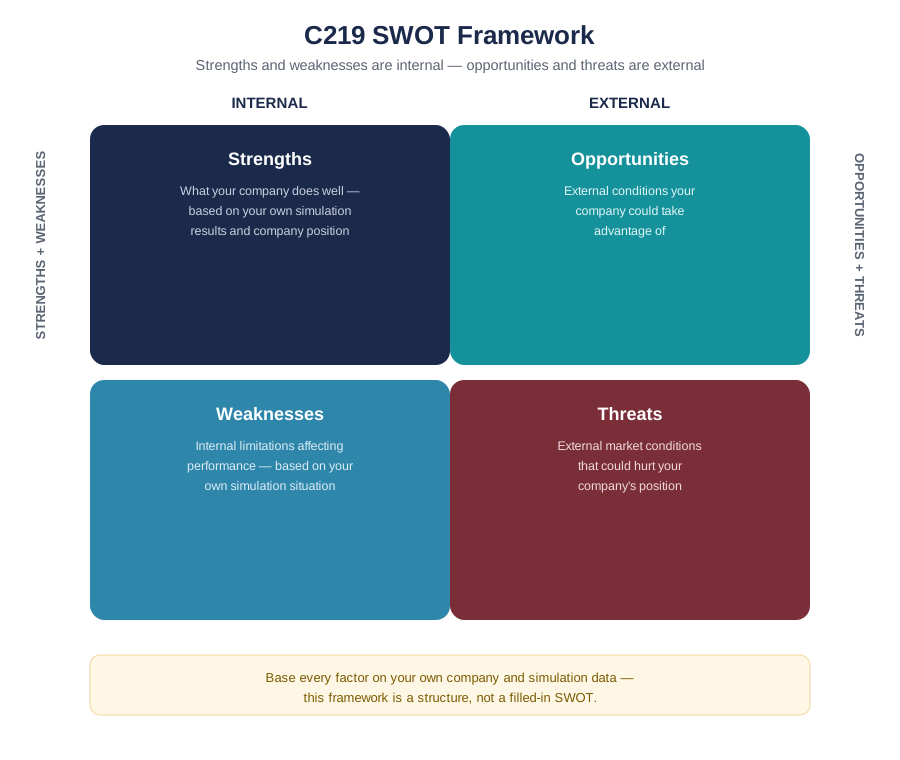
Build out all four categories in the SWOT table required in your slides:
- Strengths: internal
- Weaknesses: internal
- Opportunities: external
- Threats: external
This internal/external split is the backbone of the next two steps, and mixing it up is one of the fastest ways to lose points. A production bottleneck is a weakness, not a threat. A shift in consumer demand is an opportunity or threat, not a strength or weakness.
Step 4: Explain the Greatest Strength and Biggest Weakness (B2a)
Pull one item from each side of your internal SWOT factors and go deep on both:
- Greatest strength: Identify it, keep it internally focused, base it on your actual simulation situation, and explain why it matters to the business.
- Biggest weakness: Same approach: internally focused, grounded in your simulation results, with a clear explanation of its business impact.
Generic answers (“strong team,” “good product”) won’t hold up. Tie each one to something specific your simulation data actually shows.
Step 5: Explain the Best Opportunity and Greatest Threat (B2b)
Same depth requirement, external factors this time:
- Best opportunity: identify it, explain why it matters, connect it directly to the business.
- Greatest threat: identify it, explain why it matters, connect it directly to the business.
Watch the boundary line again here: don’t let an internal problem masquerade as a threat, and don’t let a market condition get filed as a weakness.
Step 6: Build the Q4–Q6 Company Strategies (B3)
You have to address all five strategies, no exceptions:
- Marketing strategy
- Sales channel strategy
- Human resource strategy
- Manufacturing strategy
- Financial strategy
For each one, use this structure:
Past Performance → Problem/Opportunity → Q4–Q6 Strategy → Expected Business Direction
The rubric specifically wants the rationale grounded in past simulation performance: not generic MBA theory. If a strategy statement could apply to any company in any simulation, it needs more specificity pulled from your own results.
Step 7: Explain Two Anticipated Benefits (B3a)
Identify two logical benefits that follow from the Q4–Q6 strategies you just laid out. Avoid vague language like “increase success,” “improve the company,” or “make more money”: none of those describe an actual outcome.
Use this connection:
Strategy → Expected Change → Business Benefit
A strong benefit statement names what specifically changes and why an investor should care.
Step 8: Recommend Implementation Steps for Two Strategies (B4)
Choose two of the five strategies from Step 6. For each one, recommend two specific implementation steps: decisions that land in Q4, Q5, or Q6 and are grounded in your tactical plan.
Selected Strategy
Implementation Step 1: [specific Q4/Q5/Q6 decision from your tactical plan]
Implementation Step 2: [specific Q4/Q5/Q6 decision from your tactical plan]
“Increase marketing” or “improve production” won’t pass: those are goals, not decisions. An implementation step should read like an actual tactical-plan entry: what changes, by how much, and in which quarter.
How to Use the C219 Simulation Data
Knowing where each piece of evidence lives saves you from digging through the simulation twice.
| C219 Requirement | Simulation Data to Check | What You Need to Extract |
|---|---|---|
| B1a | Market share/sales report | Two decisions + sales impact |
| B1b | Financial summary | Two decisions + financial impact |
| B2 | Simulation/company data | SWOT factors |
| B3 | Q1–Q3 performance + tactical plan | Q4–Q6 strategies |
| B4 | Tactical plan | Specific implementation decisions |
Never fabricate a number to fill a gap. If you can’t find the evidence for a claim, go back into the simulation reports rather than guessing.
How to Build the C219 PowerPoint
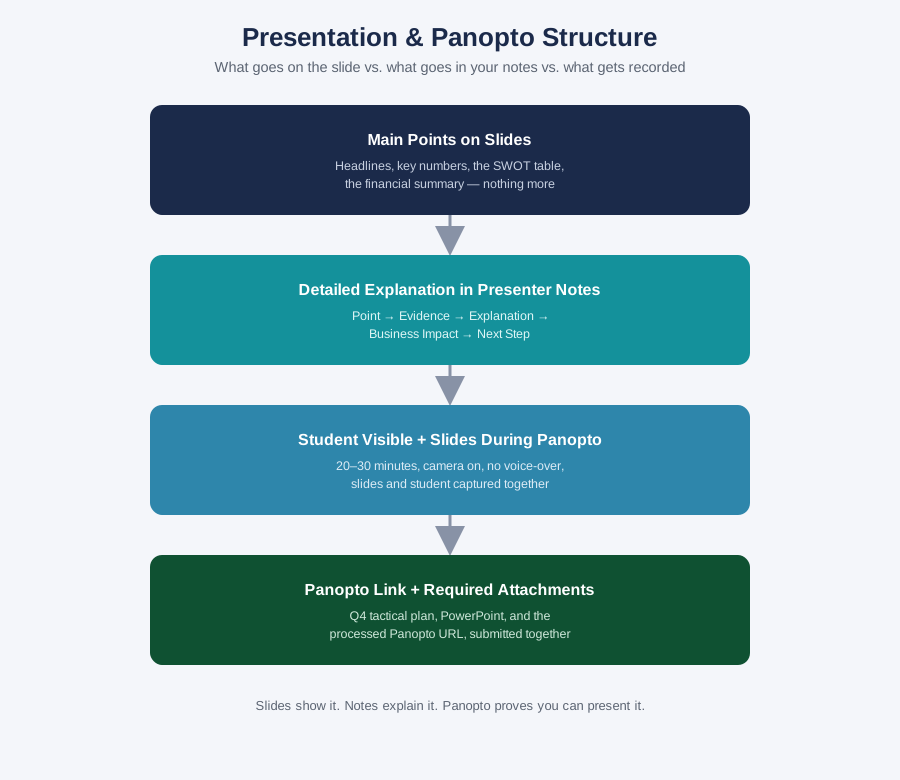
Work from the official Presentation Template and keep every slide lean.
- Each slide should carry only the main point, not the full explanation.
- Put the detailed reasoning in the presenter notes.
- Keep simulation numbers formatted so an investor could read them at a glance.
- Include the completed SWOT table on its own slide.
- Double-check that the financial summary matches your actual simulation output.
- Use consistent terminology across slides: don’t rename a strategy halfway through the deck.
The core rule: slide = what the investor needs to see; presenter notes = what you need to explain. If you find yourself writing paragraphs on a slide, that content belongs in the notes instead.
How to Write Strong Presenter Notes
Presenter notes are where you actually demonstrate your reasoning, so don’t let them become an afterthought. For each slide, use your notes to cover:
- Why the decision was made
- What the simulation data shows
- What changed
- Why the change matters
- What the company plans to do next
- Why the investor should care
A simple formula keeps these consistent:
Point → Evidence → Explanation → Business Impact → Next Step
You don’t need a fully scripted word-for-word speech: just enough substance that someone reading only your notes would understand your full argument.
How to Record C219 Task 1 in Panopto
The recording requirements are specific, so build your setup around them before you hit record:
- Aim for 20–30 minutes total.
- You need to be visible on camera the entire time.
- Your slides must display simultaneously with your video feed.
- Log into Panopto through the “WGU” option using your student portal credentials.
- Upload to the required drop box and wait for processing to finish.
- Retrieve the final URL and paste it into the Links section of your submission: external hosting sites aren’t accepted.
Do a short test recording first to confirm both your camera and your screen share are capturing correctly before you record the full presentation.
C219 Task 1 Sources and Citations
Any information you quote, paraphrase, or summarize from an outside source needs both an in-text citation and a matching reference list entry. Keep this simple: cite consistently, make sure every in-text citation has a corresponding reference, and make sure each reference includes the author, date, title, and source location where available.
C219 Task 1 Professional Communication Check
Your submission goes through Grammarly for Education before evaluation, and the overall assessment won’t pass if this piece fails: so don’t treat it as optional. Before you submit:
- Run the full deck and notes through Grammarly for Education and clear flagged issues.
- Read your presenter notes out loud once: awkward phrasing is easier to hear than to see.
- Check that terminology is consistent across every slide.
- Confirm punctuation and spelling in your SWOT table and financial summary, not just your paragraphs.
Common C219 Task 1 Mistakes
- Naming decisions without explaining their effects: always close the loop with the “why” behind the result.
- Using numbers without explaining what they mean: a figure alone isn’t analysis.
- Using generic SWOT factors: ground every factor in your own simulation situation.
- Confusing internal and external SWOT factors: strengths/weaknesses stay internal, opportunities/threats stay external.
- Addressing only some of the five strategies: all five are required, not just your strongest ones.
- Giving vague implementation steps: “improve manufacturing” isn’t a decision; a specific tactical-plan change is.
- Ignoring the tactical plan: your B4 steps need to trace back to it.
- Putting too much text on slides: move detail into presenter notes.
- Leaving presenter notes weak or empty: this is where your reasoning actually lives.
- Providing inaccurate simulation data: double-check every figure against your exported reports.
- Forgetting the SWOT table: it needs to appear in the slides themselves, not just be discussed verbally.
- Forgetting the Panopto link: confirm processing finished before you submit.
- Submitting incomplete attachments: all three files/links are required together.
- Skipping the grammar check: Grammarly for Education has to pass before the overall submission can.
What a Competent C219 Task 1 Response Looks Like
| Requirement | Competent Response |
|---|---|
| B1a | Two specific decisions logically connected to Q1–Q3 competitive sales performance |
| B1b | Two specific decisions logically connected to financial performance |
| B2 | Complete SWOT table |
| B2a | Specific internal strength and weakness |
| B2b | Specific external opportunity and threat |
| B3 | All five strategies explained using past performance |
| B3a | Two logical anticipated benefits |
| B4 | Two selected strategies with two specific implementation steps each |
| C | Accurate in-text citations and references |
| D | Clear professional communication |
This reflects the rubric’s own definition of “competent.” It doesn’t guarantee a passing evaluation: that call belongs to your evaluator.
Already working on C219 but not sure whether your analysis is strong enough? Get a second set of eyes before you submit: a review of your rubric coverage, your SWOT logic, and how well your evidence actually connects to your decisions.
C219 Task 1 Final Submission Checklist
- Q4 tactical plan completed
- Q5 projections entered
- Q6 projections entered
- Presentation Template completed
- Presenter notes completed
- Q1–Q3 competitive sales analysis completed
- Q1–Q3 financial analysis completed
- SWOT table completed
- Greatest strength explained
- Biggest weakness explained
- Best opportunity explained
- Greatest threat explained
- All five Q4–Q6 strategies addressed
- Two anticipated benefits explained
- Two strategies selected for B4
- Two implementation steps provided for each selected strategy
- Financial information checked
- Sources cited
- Reference list completed
- Grammarly review completed
- Panopto recording completed
- Student visible in recording
- Presentation visible in recording
- Panopto link ready
- Required files attached
- Final submission reviewed against the rubric
C219 Task 1: The Fastest Way to Approach the Task
- Finish the simulation data.
- Pull Q1–Q3 evidence.
- Identify two sales decisions.
- Identify two financial decisions.
- Complete the SWOT.
- Build the five Q4–Q6 strategies.
- Choose two strategies for B4.
- Add specific implementation decisions.
- Build the slides and presenter notes.
- Record Panopto.
- Run the rubric checklist.
- Submit.
Work through it in this order and you’ll avoid the back-and-forth that eats up the most time: pulling evidence after you’ve already started writing, or building slides before your tactical plan is finalized.
Need a second set of eyes on your C219 Task 1? Get practical guidance and review support before you submit.
Helpful Resources
WGU D361 Task 2 Example and Guide: Competitive Analysis (SWOT, Strategic Graphs, SMART Goals)
C207 QUM3 Task 1 Example and Guide: Regression Analysis – Data-Driven Decision Making C207 PRFA
EHM2 C206 Task 2 (Paradigm Toys): Competent Example and Guide
WGU D472 Task 1 Guide: Operations and Supply Chain Disruption Presentation
WGU D473 Task 1 Guide: How to Identify Root Cause Variables Using Data Analysis