
D361 Task 2: WGU Business Simulation and Competitive Analysis Explained


D361 Task 2 asks you to take the company you’ve been running inside the WGU business simulation and answer a different question than Task 1 did. Instead of reporting what happened, you’re evaluating where the company actually stands against its competitors after six quarters, and recommending what it should do next. That means the assignment leans on strategic analysis: a SWOT, an interpretation of the strategic graphs from the simulation, and a SMART goal built from your own results.
If you’re still working through Task 1, or you’ve just been cleared to start Task 2 and want to know what’s different, this is the place to start. For the full section-by-section walkthrough of the assignment, our D361 Task 2 guide covers the rubric in detail.
What Is D361 Task 2?
D361 Task 2 evaluates your simulated company’s competitive position after the first six quarters of decisions and asks you to turn that evaluation into a forward-looking recommendation. It’s not a summary of results, it’s an interpretation of what those results mean strategically.
The assessment moves through three connected pieces:
SWOT Analysis → Competitive Analysis (Strategic Graphs) → Strategic Recommendation / SMART Goal
You start by identifying your company’s internal strengths and weaknesses along with the external opportunities and threats it’s facing. From there, you interpret the strategic graphs the simulation generates to understand how your company compares to competitors. Finally, you turn that analysis into a specific, measurable goal for where the company should go next.
This is the piece that trips students up the most: Task 2 is not primarily about restating numbers. It’s about explaining what those numbers mean for your company’s competitive standing. If you want the detailed breakdown of each rubric area, the D361 Task 2 SWOT and competitive analysis guide walks through it section by section.
What Is WGU D361?
WGU D361 is a business simulation course. You run a simulated company over multiple quarters, making decisions about pricing, marketing, production, and other operational areas, and the simulation generates performance and competitive data based on those choices.
The course builds toward two connected assessments, both of which draw on the same simulated business:
- You need to make your own decisions across the quarters, since the results are specific to your run of the simulation.
- Your business performance data (financials, sales, competitive standing) becomes the evidence base for both Task 1 and Task 2.
- Task 2 depends directly on the business history you built during the simulation. It’s not a generic case study; it’s an analysis of your company.
Because both assessments pull from the same simulated business, it helps to understand the full D361 WGU sequence before you dive into either task.
WGU D361 Simulation Steps: Where Task 2 Fits
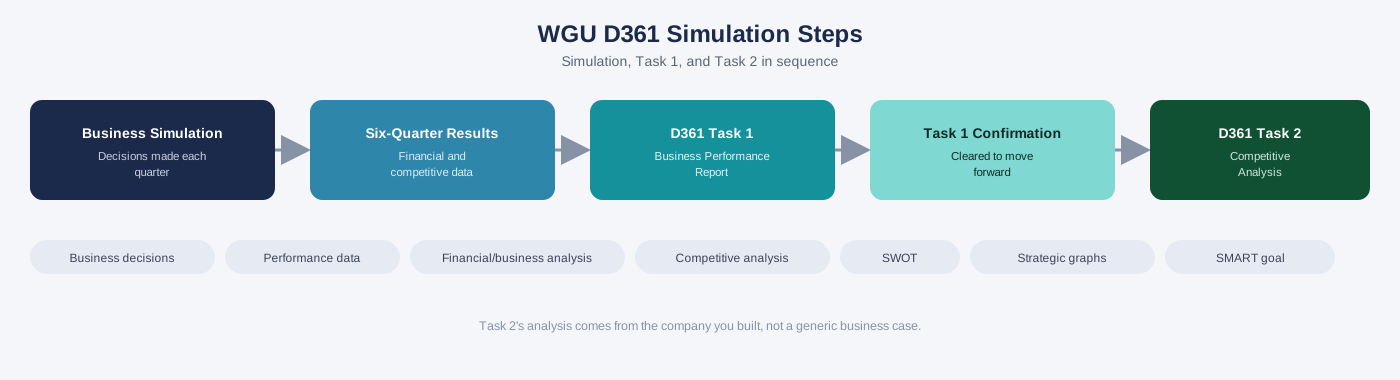
Here’s the basic order of the WGU D361 simulation steps:
- Start D361. Get access to the course and the business simulation.
- Complete the marketplace simulation. Make decisions across the required quarters.
- Make business decisions across the quarters. Pricing, marketing, production, and other operational choices shape your company’s results.
- Review your simulation results. Look at your financial and competitive data before you start writing.
- Complete D361 Task 1. Analyze what happened and why, using your business performance data.
- Receive Task 1 confirmation. Task 2 typically follows once Task 1 is complete.
- Complete D361 Task 2. Analyze your competitive position and recommend a SMART goal.
The point of laying this out is simple: Task 2 isn’t something you can approach as a standalone business essay. Its entire analysis comes from the company you built and the decisions you made along the way. If you skip straight to Task 2 without reviewing your six-quarter results, you’ll spend more time hunting for evidence than actually writing the analysis.
What Does D361 Task 2 Actually Ask You to Analyze?
Task 2 has three connected components. Here’s what each one covers at a high level.
SWOT Analysis
You’ll identify your company’s strengths, weaknesses, opportunities, and threats, based on evidence from your six-quarter simulation.
Strengths and weaknesses are internal. They describe something about your company itself, like production efficiency or a limited product line.
Opportunities and threats are external. They describe market conditions, competitor behavior, or industry trends outside your company’s direct control.
The distinction matters because mixing them up is one of the fastest ways to weaken this section. A staffing shortage is a weakness, not a threat. A shift in customer demand is an opportunity or threat, not a strength or weakness. For the deeper explanation of what a competent SWOT response looks like, see the D361 Task 2 guide.
Competitive Analysis and Strategic Graphs
This is where students most often get stuck. The simulation gives you strategic graphs showing how your company’s metrics changed over six quarters, and the assignment wants you to interpret them, not just describe them.
A useful structure:
Decision → Data Trend → Competitive Effect → Business Explanation
Saying “market share increased” isn’t analysis. Explaining which decision likely drove that increase, how it compares to competitor movement, and why it matters strategically is analysis.
SMART Goal
Once you’ve established where the company stands competitively, Task 2 asks you to set a specific goal for where it should go next. This is a shift from analysis to recommendation, and it needs to be genuinely SMART:
- Specific target
- Measurable result
- Achievable based on current performance
- Relevant to the competitive problem you identified
- Time-bound with a clear deadline
“Increase market share” isn’t a SMART goal. It doesn’t say by how much, by when, or why that specific target is realistic given your company’s current position. The full walkthrough of how to build this section is in the detailed D361 Task 2 guide.
D361 Task 1 vs D361 Task 2
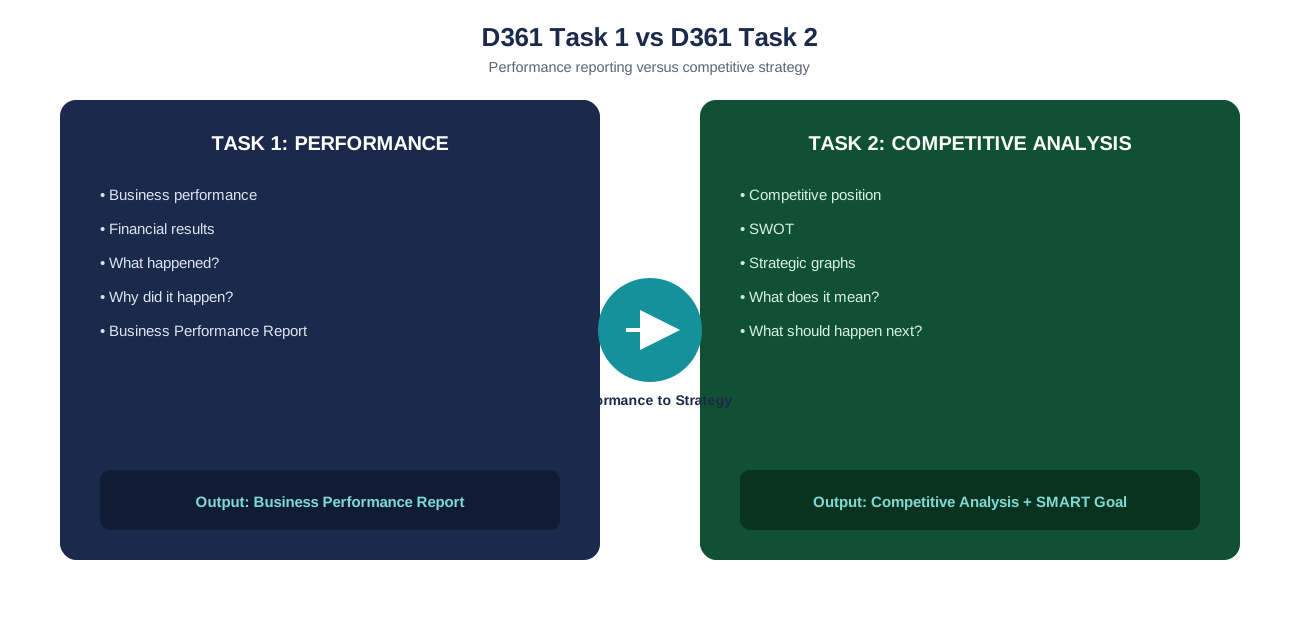
The simplest way to separate the two assessments:
Task 1 asks: what happened, and why?
Task 2 asks: what does it mean competitively, and what should happen next?
| Area | D361 Task 1 | D361 Task 2 |
|---|---|---|
| Main focus | Business performance | Competitive position |
| Main evidence | Financial/business performance data | SWOT and strategic simulation data |
| Analysis style | Performance interpretation | Strategic analysis |
| Key question | What happened? | What does it mean, and what comes next? |
| Output | Business Performance Report | Competitive Analysis |
| Forward-looking component | Business implications | SMART goal |
Task 1 is grounded in reporting and interpreting your financial and operational results. Task 2 builds on that foundation but pushes into strategic territory: competitive standing, external market factors, and a concrete plan for the next stretch of quarters. For a full side-by-side breakdown, including how difficulty and time investment compare, see D361 Task 1 vs D361 Task 2: Key Differences, Expectations, and How to Pass Both.
What Should You Have From D361 Task 1 Before Starting Task 2?
Task 2 isn’t interchangeable with Task 1, but it does depend on it. Both assessments draw from the same simulated business, and the analysis you did for Task 1 (your financial results, your understanding of what drove performance) becomes background context you’ll need again in Task 2.
Before you start Task 2, you should have:
- A clear understanding of your company’s financial and operational performance through six quarters.
- Familiarity with which decisions produced which results.
- Your simulation reports and data on hand, since Task 2’s SWOT and strategic graph analysis reference the same underlying business.
If you’re still working through the Business Performance Report itself, our WGU D361 Task 1 guide covers what that assessment requires in detail.
How to Approach the D361 SWOT Analysis
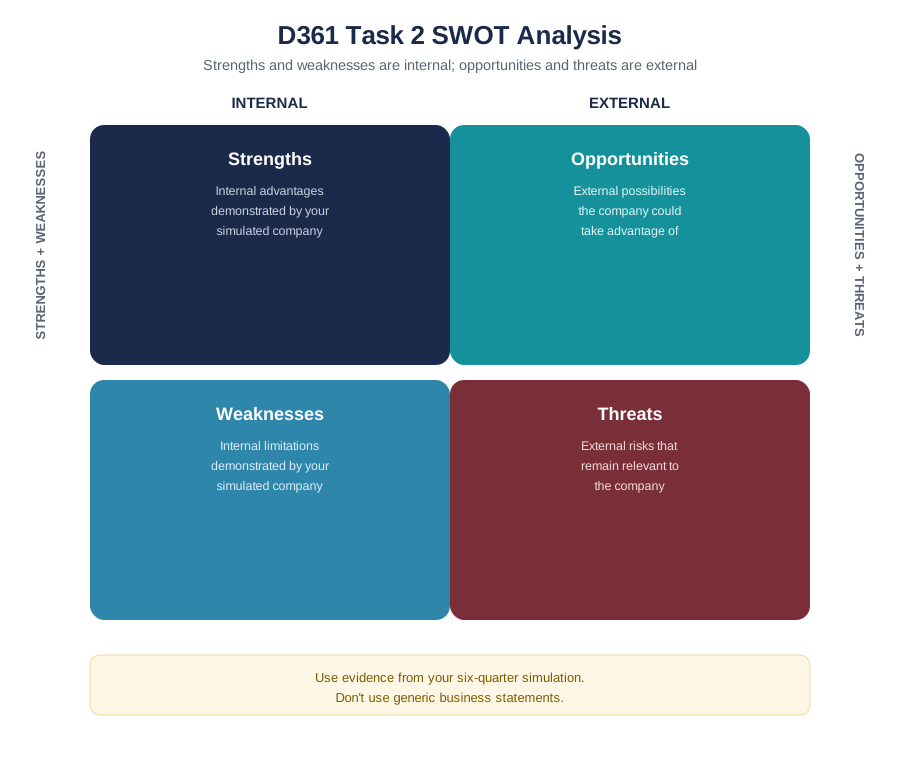
A quick refresher on each category:
Strength: an internal advantage demonstrated by your simulated company.
Weakness: an internal limitation demonstrated by your simulated company.
Opportunity: an external condition your company could take advantage of.
Threat: an external condition that could work against your company.
For each point, use this structure:
SWOT Point → Simulation Evidence → Why It Matters
Generic statements are weak. Writing “strong brand” and moving on doesn’t tell an evaluator anything specific. What in your simulation results actually supports that claim? What number, trend, or decision backs it up? That’s the difference between naming a factor and analyzing one.
How to Analyze D361 Strategic Graphs
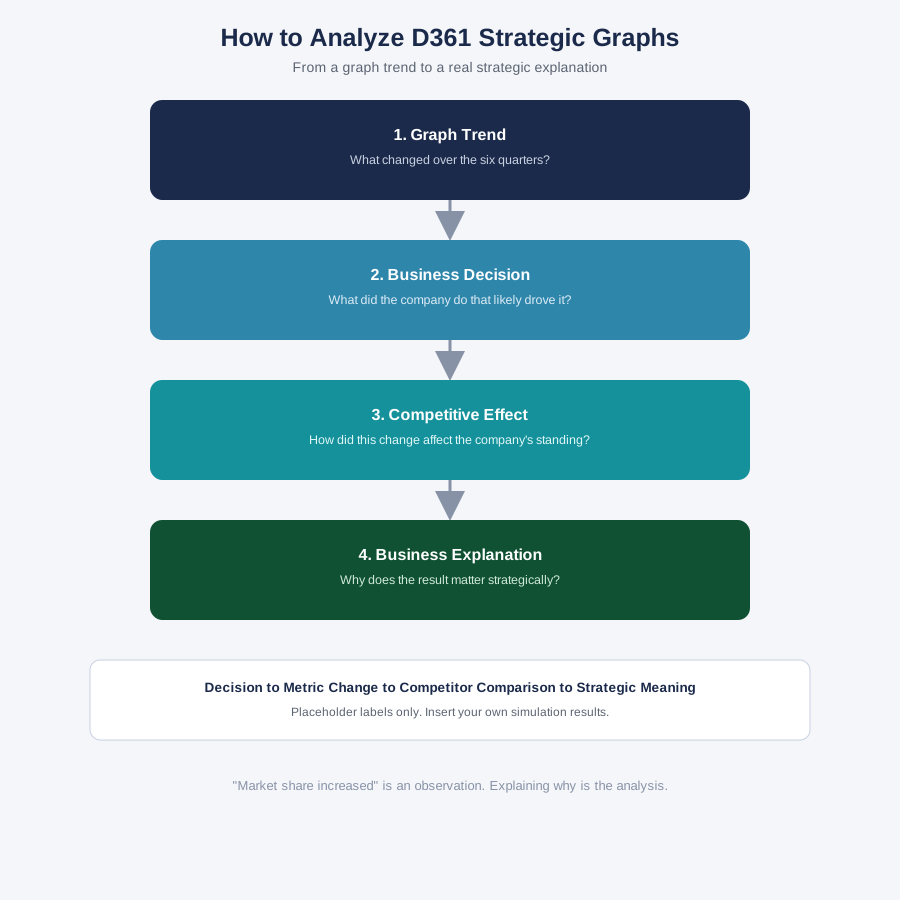
Reading a strategic graph and analyzing one are different skills. Here’s the process:
- Identify the metric. What is the graph actually measuring?
- Identify the trend. What changed across the six quarters?
- Compare competitive position. How does your company’s trend compare to competitors, where that data is available?
- Identify the relevant decision. What choice you made likely contributed to the change?
- Explain the competitive effect. Why does this trend matter for your company’s position in the market?
Use this chain: Decision → Trend → Competitive Impact.
Don’t stop at “market share increased.” That’s an observation, not an analysis. The evaluator wants to see why it increased and what that means strategically. Our D361 Task 2 guide goes deeper into how to pull the right evidence from each graph.
How to Build the D361 Task 2 SMART Goal
A SMART goal checklist for this assignment:
- Specific target: a defined outcome, not a general direction
- Measurable result: something you can point to and confirm was hit or missed
- Achievable based on your company’s current performance
- Relevant to the competitive problem your analysis identified
- Clear deadline
“Increase market share” fails on almost every point. It doesn’t say how much, doesn’t connect to a specific competitive problem, and doesn’t set a timeframe. A stronger version defines the outcome, ties it back to what your SWOT and strategic graph analysis actually found, and gives it a deadline grounded in your simulation’s quarter structure. Insert your own simulation figures here; don’t borrow numbers from an example.
Common D361 Task 2 Mistakes
Using Generic SWOT Statements
Naming a factor without tying it to simulation evidence reads as filler. Ground every SWOT point in something specific your company actually experienced.
Describing Graphs Instead of Analyzing Them
Stating what a graph shows isn’t the same as explaining why it matters competitively. Push past the description into the “so what.”
Ignoring Competitor Data
Where competitor data is available in the simulation, use it. Competitive analysis without any competitive comparison is incomplete.
Choosing Evidence That Doesn’t Support the Claim
If your evidence doesn’t actually back up the SWOT point or strategic claim you’re making, the analysis falls apart. Pick evidence that clearly supports the specific claim.
Writing a Vague SMART Goal
A goal without a number and a deadline isn’t SMART, no matter how reasonable it sounds.
Treating Task 2 Like Task 1
Task 2 isn’t a second performance report. It’s a strategic evaluation. If your Task 2 draft reads like a restatement of your Task 1 results, you’ve missed the shift the assignment is asking for.
Starting Without Understanding the Simulation Data
Trying to write the analysis before you’ve actually reviewed your six-quarter results leads to vague, unsupported claims. Review the data first.
Repeating the Same Information Across Sections
Each section of Task 2 should add something new. If your SWOT, your competitive analysis, and your SMART goal all repeat the same point, you’re not covering the full scope of the assignment.
Is D361 Task 2 Hard?
It depends on which kind of analysis comes naturally to you. Students who are comfortable with strategic thinking, comparing trends, weighing competitive factors, tend to find Task 2 more intuitive than Task 1. Students who prefer structured financial reporting sometimes find Task 1 more straightforward.
The real difficulty in Task 2 isn’t the format, it’s connecting evidence to conclusions. It’s easy to list a SWOT factor or describe a graph; it’s harder to explain convincingly why that factor or trend actually matters for the company’s competitive position. That’s the skill this assignment is testing.
For a deeper look at how the two assessments compare on difficulty and time investment, see D361 Task 1 vs D361 Task 2: Key Differences, Expectations, and How to Pass Both.
How to Start D361 Task 2 If You’re Short on Time
- Confirm where you are in the D361 sequence.
- Gather your simulation results.
- Review the six-quarter competitive position.
- Identify four evidence-backed SWOT factors.
- Review the strategic graphs.
- Select the strongest evidence.
- Build the competitive analysis.
- Create the SMART goal.
- Check every section against the rubric.
- Submit only after the final review.
Working through it in this order keeps you from writing sections out of sequence and then realizing halfway through that your evidence doesn’t actually support your SWOT or your SMART goal.
Not sure whether your D361 Task 2 analysis is strong enough? Get a second set of eyes before you submit, on your SWOT logic, your strategic graph interpretation, or how well your SMART goal connects to your evidence.

References
- Puyt, R. W., Lie, F. B., & Wilderom, C. P. M. (2023). The origins of SWOT analysis. Long Range Planning, 56(3), Article 102304. https://doi.org/10.1016/j.lrp.2023.102304 (Peer-reviewed; archival research tracing SWOT’s development from the Stanford Research Institute’s SOFT approach, useful background for how the internal/external distinction came about.)
- Pangarkar, N., & Prabhudesai, R. (2024). Using Porter’s Five Forces analysis to drive strategy. Global Business and Organizational Excellence, 43(5), 24-34. https://doi.org/10.1002/joe.22250 (Peer-reviewed; a current, practitioner-oriented walkthrough of applying competitive forces analysis, directly relevant to Task 2’s competitive-position evaluation.)
- Swann, C., Jackman, P. C., Lawrence, A., Hawkins, R. M., Goddard, S. G., Williamson, O., Schweickle, M. J., Vella, S. A., Rosenbaum, S., & Ekkekakis, P. (2023). The (over)use of SMART goals for physical activity promotion: A narrative review and critique. Health Psychology Review, 17(2), 211-226. https://doi.org/10.1080/17437199.2021.2023608 (Peer-reviewed; a critical look at where SMART goal-setting is well supported and where it’s overapplied, useful context for writing a goal that’s genuinely justified rather than just formatted correctly.)
- Pietsch, S., Riddell, H., Semmler, C., Ntoumanis, N., & Gucciardi, D. F. (2024). SMART goals are no more effective for creative performance than do-your-best goals or non-specific, exploratory “open goals.” Educational Psychology, 44(8), 946-962. https://doi.org/10.1080/01443410.2024.2420818 (Peer-reviewed; recent experimental evidence on where the SMART format helps and where it doesn’t, worth knowing before treating SMART as a guaranteed formula.)
- Faisal, N., Chadhar, M., Goriss-Hunter, A., & Stranieri, A. (2022). Business simulation games in higher education: A systematic review of empirical research. Human Behavior and Emerging Technologies, 2022, Article 1578791. https://doi.org/10.1155/2022/1578791 (Peer-reviewed; a systematic review of how business simulations affect student learning outcomes, relevant background on why courses like D361 use simulation-based assessment.)