
C207 Task 1 vs C207 Task 2: Key Differences, Expectations, and How to Pass Both


C207 Task 1 vs C207 Task 2
Introduction
C207, WGU’s Data-Driven Decision Making course, is where you put statistics to work on real managerial questions. Most of the confusion around this course isn’t about the math; it’s about which kind of analysis each task is actually asking for, and why.
Both tasks belong to the same course and both use Excel-based analysis, but they test genuinely different techniques. Task 1 centers on linear regression: identifying a relationship between two variables and using it to answer a business question. Task 2 centers on decision tree analysis: mapping out a sequence of business decisions and their possible outcomes to identify the choice with the best expected payoff. One is about explaining a relationship in existing data; the other is about choosing between future options under uncertainty.
In this guide, you’ll learn:
- What each task assesses and how the two analyses differ
- Which task tends to be harder — and why that depends on the student
- The mistakes that most often trigger a revision
- How to prepare for each task before you open Excel
This is a planning and strategy resource. It’s designed to help you understand what each task expects — not to run your specific analysis or write your submission for you.
Quick Answer
While C207 Task 1 and Task 2 are both performance assessments within the Data-Driven Decision Making course, they test different analytical techniques. Task 1 asks you to conduct a linear regression analysis: you propose a business question, examine the relationship between two variables, and use the regression output to support a recommendation. Task 2 asks you to conduct a decision tree analysis: you’re given a business scenario with multiple possible decisions and outcomes, and you calculate expected values to recommend the option with the strongest expected payoff.
In practice, Task 1 rewards careful data interpretation and clear statistical communication, while Task 2 rewards structured decision-making under uncertainty. Students who are comfortable with statistics and correlation often move through Task 1 quickly, while students who think well in terms of scenarios and probabilities sometimes find Task 2 more intuitive — even though both tasks ultimately ask you to turn numbers into a business recommendation. Understanding this distinction before you start helps you plan your Excel work, choose which task to tackle first, and avoid submitting the wrong kind of analysis for what the rubric is asking.
Quick Comparison Table
| Feature | C207 Task 1 | C207 Task 2 |
|---|---|---|
| Objective | Use linear regression to examine a relationship and answer a business question | Use decision tree analysis to recommend the best course of action under uncertainty |
| Skills Tested | Statistical interpretation, correlation vs. causation reasoning, data communication | Structured decision-making, expected value calculation, scenario analysis |
| Deliverables | Business report with regression output, scatterplot, and written interpretation | Business report with a decision tree diagram, payoff values, and a recommendation |
| Expected Length | Concise, rubric-driven sections | Similar length, with more emphasis on visual decision mapping |
| Critical Thinking | Moderate — interpreting statistical significance and relationships | High — weighing multiple outcomes and probabilities before recommending |
| Research | Simulation/course data plus supporting sources | Simulation/course data plus supporting sources |
| APA Requirements | Required for supporting sources and citations | Required for supporting sources and citations |
| Time Commitment | Moderate; regression setup in Excel is usually the longest step | Moderate to high; building the decision tree accurately takes care |
| Common Challenges | Confusing correlation with causation, weak justification for the regression’s business relevance | Errors in expected value math, decision tree diagrams that don’t match the payoff table |
What Is C207 Task 1?
C207 Task 1 asks you to apply linear regression to a business question of your choosing (within the parameters your rubric sets). You’ll typically propose a question that a relationship between two variables could help answer, run the regression, and interpret what it means for the business.
What you’ll typically work with:
- A clearly stated business question suited to linear regression
- A dataset (often course-provided) with an independent and dependent variable
- Excel-based regression output, including the scatterplot, trendline, and regression statistics
- A written interpretation connecting the statistical output to a business recommendation
What evaluators generally look for, based on the published rubric and assignment instructions:
- A business question that’s actually answerable with linear regression — not just loosely related to the data
- Correctly generated Excel output (regression statistics, scatterplot with trendline), not screenshots of the wrong chart type
- A clear explanation of what the relationship means, including its strength and direction
- An honest discussion of the analysis’s limitations — regression shows correlation, not necessarily causation
Where students most often need revisions: Many students find revision requests come from treating a statistically significant relationship as proof of causation, or from a business question that doesn’t quite match what the regression analysis can actually tell you. Reviewing the rubric’s requirements for limitations and interpretation before you draft your write-up tends to prevent both issues.
Read our complete C207 Task 1 Guide for a step-by-step walkthrough of each section.
What Is C207 Task 2?
C207 Task 2 shifts from explaining a relationship to choosing between future options. You’re typically given (or asked to construct) a business scenario involving a decision — such as whether to launch, modify, or hold a product line — along with probabilities and payoffs for each possible outcome.
What it typically covers:
- Purpose: recommending the best course of action using decision tree analysis
- Required deliverables: a payoff table, a decision tree diagram, and expected value calculations for each branch
- Competencies assessed: structured decision-making, quantitative reasoning under uncertainty, and business communication
What evaluators generally look for:
- A decision tree that accurately reflects the scenario’s decision points and chance events
- Correct expected value calculations at each node, with the math shown clearly
- A recommendation that’s explicitly tied to the expected values — not just a gut-feel choice
- Discussion of what the analysis doesn’t capture (for example, risk tolerance or qualitative factors outside the numbers)
Where students most often need revisions: Task 2 revisions often cluster around calculation errors — probabilities that don’t sum to one along a branch, or expected values that don’t match the tree — as well as a decision tree diagram that doesn’t visually match the payoff table it’s based on. Many students find that building the payoff table first, then the tree, then the calculations (in that order) reduces these mismatches.
See our detailed C207 Task 2 Guide for examples and practical tips.
Major Differences Between C207 Task 1 and Task 2
| Area | Task 1 | Task 2 |
|---|---|---|
| Objective | Explain a relationship in existing data | Recommend a choice among future options |
| Research Required | Course/simulation data plus supporting sources | Course/simulation data plus supporting sources |
| Critical Thinking | Interpreting statistical strength and relevance | Weighing probabilities and payoffs across branches |
| Writing Style | Descriptive and statistically precise | Structured, decision-focused, evidence-driven |
| Data Analysis | Linear regression (correlation, trendline, R²) | Decision tree analysis (expected value, payoff table) |
| Business Application | Understanding what’s driving an outcome | Choosing the best path forward under uncertainty |
| Length | Rubric-driven, moderate | Rubric-driven, similar length with more visual components |
Why these differences matter: Task 1 is closer to diagnostic analytics — using data to explain what’s happening. Task 2 is closer to prescriptive analytics — using data to decide what to do next. Recognizing which mode you’re in helps you match your Excel approach and your write-up structure to what the rubric is actually measuring.
Which Task Is More Difficult?
There’s no universal answer, and it’s worth being skeptical of any guide that ranks the two definitively. What’s true is that they load differently on different skills:
- Critical thinking required: Task 2 generally demands more structured, multi-step reasoning, since you’re evaluating several branches at once.
- Amount of analysis: Task 1’s analysis is more contained (one relationship, one interpretation); Task 2’s analysis expands across multiple decision points.
- Statistical vs. structural thinking: Task 1 rewards comfort with statistical concepts like correlation and significance; Task 2 rewards comfort with structured, scenario-based reasoning.
- Room for calculation error: Task 2’s multi-step expected value math offers more opportunities for a small error to cascade through the analysis.
Students who are comfortable with statistics often move through Task 1 more quickly. Students who think naturally in terms of scenarios and trade-offs sometimes find Task 2 more intuitive, even if the calculations take longer to verify. If you’re unsure which will be harder for you, skim both rubrics before starting either task.
Common Mistakes Students Make
Task 1
- Confusing correlation with causation — describing the regression relationship as if it proves one variable causes the other.
- Weak business framing — a regression that’s technically correct but isn’t clearly tied back to a specific, answerable business question.
- Incomplete Excel output — missing the scatterplot, trendline, or full regression statistics table the rubric requires.
Task 2
- Calculation errors — probabilities on a branch that don’t sum to one, or expected values that don’t match the payoff table.
- Mismatched tree and table — a decision tree diagram that doesn’t accurately reflect the payoff table it’s supposed to represent.
- Weak recommendation justification — recommending an option without clearly explaining why its expected value makes it the stronger choice.

Rubric Alignment Checklist
Use this quick checklist before you submit either task:
- Every rubric criterion has a corresponding heading or clearly labeled section in your draft
- Task 1: scatterplot, trendline, and full regression statistics are included (not screenshots of the wrong output)
- Task 1: your interpretation avoids causal language unless the rubric specifically supports it
- Task 2: your payoff table, decision tree, and expected value calculations all match each other
- Task 2: probabilities on each branch sum to 1
- Your recommendation (either task) is explicitly tied back to your analysis, not just asserted
- APA formatting is applied consistently to all in-text citations and references
Time Planning Guide
A rough planning breakdown many students find workable — adjust based on your own pace and comfort with Excel:
| Phase | Task 1 | Task 2 |
|---|---|---|
| Reviewing rubric and scenario | 30–45 minutes | 30–45 minutes |
| Running the analysis in Excel | 60–90 minutes | 60–120 minutes |
| Outlining | 30 minutes | 30–45 minutes |
| Writing | 2–3 hours | 2.5–3.5 hours |
| Proofreading and rubric check | 30–45 minutes | 45–60 minutes |
Breaking the work into separate analysis, writing, and proofreading sessions — rather than trying to complete everything in one sitting — tends to reduce both fatigue and calculation errors.
Revision Insights
Across both tasks, the most common reasons submissions come back for revision tend to fall into a few categories:
- Analytical errors — incorrect regression setup on Task 1, or expected value miscalculations on Task 2.
- Interpretation gaps — conclusions that overstate what the analysis actually shows (especially causal language on Task 1).
- Inconsistency between visuals and numbers — a chart or tree that doesn’t match the underlying data or table.
If your task is returned for revision, treat the evaluator’s comments as a rubric map: address each point individually, and recheck your underlying calculations — not just your writing — before resubmitting.
Decision Guide: Where Should You Focus First?
If you’re planning your time across C207, a simple way to decide where to start:
- More confident with statistics than scenario planning? Start with Task 1 to build momentum before moving to the more structurally complex Task 2.
- More comfortable thinking in branches and trade-offs than in correlation coefficients? Consider reviewing Task 2’s rubric early, even if you complete Task 1 first — sketching a rough decision tree can clarify your thinking before you touch the numbers.
- Unsure which is harder for you? Read both rubrics in full before starting either task. The rubric — not this guide or anyone else’s experience — is the real source of truth for what’s expected.
How to Prepare Before Starting Either Task
- Review the rubric first. Confirm exactly which Excel outputs and calculations are required.
- Read the scenario carefully. Note every variable (Task 1) or decision point and payoff (Task 2) that’s relevant.
- Outline your response before writing. Map your headings directly to rubric sections.
- Gather supporting sources early. Locate APA-formatted sources for any concepts you’ll cite before you start drafting.
- Double-check your math before writing the interpretation. A wrong number early on tends to distort everything written after it.
Tips to Pass Both Tasks on the First Submission
- Follow the rubric point by point — don’t rely on memory of what “usually” gets asked.
- Show your work: include the full regression output (Task 1) or full expected value calculations (Task 2), not just the final numbers.
- Use clear headings that mirror rubric sections so an evaluator can verify requirements quickly.
- Keep your interpretation grounded in what the analysis actually shows — avoid overstating certainty.
- Proofread for clarity and formatting before you submit — a second read after a break catches more than a read right after finishing.
Frequently Asked Questions
Is C207 Task 2 harder than Task 1? Not universally. Task 2 typically demands more multi-step, structured reasoning, while Task 1 demands precise statistical interpretation. Which one feels harder often depends on whether you’re more comfortable with regression statistics or scenario-based decision-making.
Can I complete Task 2 before Task 1? Check your course sequencing, since this can vary. Even where the platform allows flexibility, the two tasks use different techniques and don’t depend on each other’s results, so completing them out of order is less disruptive here than in courses where later tasks build directly on earlier ones.
How long does each C207 task take? This varies by student, but many find Task 1 takes a bit less time once the regression is set up correctly, while Task 2 takes longer because of the multi-step expected value calculations. See the Time Planning Guide above for a rough breakdown.
Do both tasks require APA citations? Yes. Both tasks generally require APA-formatted in-text citations and references for any outside sources you use to support your analysis.
What happens if my task is returned for revision? You’ll typically receive specific evaluator feedback tied to rubric criteria. Recheck your underlying calculations first, then address each written point directly, and re-verify the entire rubric — not just the flagged section — before resubmitting.
Final Thoughts
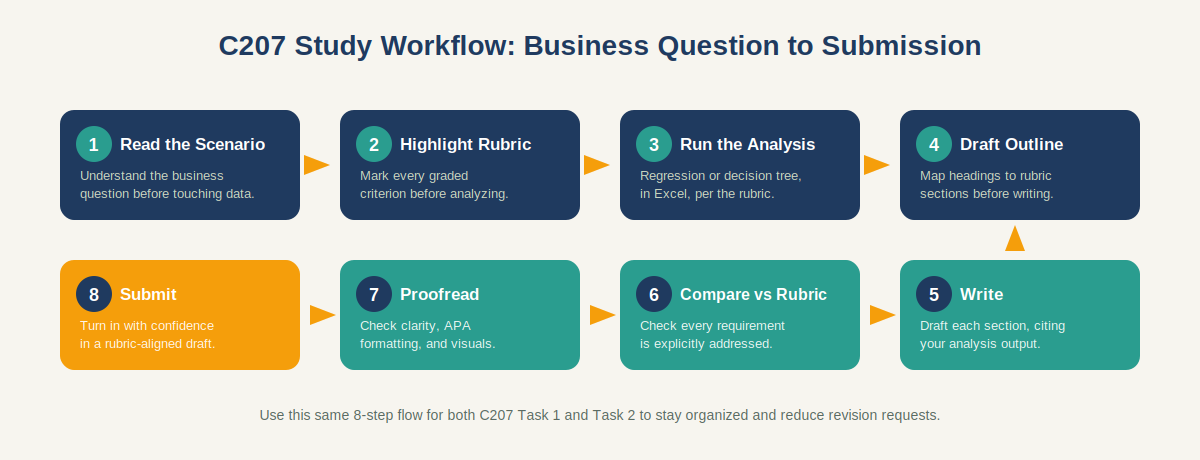
C207 Task 1 and Task 2 test two different sides of data-driven decision-making: Task 1 asks you to explain a relationship using linear regression, while Task 2 asks you to choose between future options using decision tree analysis and expected value. Neither is inherently harder — they simply reward different analytical strengths. Reviewing both rubrics before you start, double-checking your calculations before you write, and working through a consistent study workflow are the habits that most reliably lead to a first-submission pass.
Before you begin, it’s worth reading through our individual C207 Task 1 Guide and C207 Task 2 Guide for a section-by-section walkthrough, along with our APA formatting guide and WGU Performance Assessments overview if you’re new to how PAs are structured.
If you’d like a second set of eyes on your analysis or draft before you submit, our coaches are available for personalized guidance and editing support on WhatsApp. The goal is always to help you understand the material and produce work that’s genuinely your own — not to complete the assessment for you.

References
Bastian, B., Acar, O. A., Boom, H., & Smits, J. (2025). Management decisions under radical uncertainty. Management Decision, 63(13), 714–729. https://doi.org/10.1108/MD-01-2025-0079
Jepsen, D. M., & Rousseau, D. M. (2022). Perceived evidence use: Measurement and construct validation of managerial evidence use as perceived by subordinates. PLoS ONE, 17(4), e0266894. https://doi.org/10.1371/journal.pone.0266894
Karaboga, T., Zehir, C., Tatoglu, E., Karaboga, H. A., & Bouguerra, A. (2023). Big data analytics management capability and firm performance: The mediating role of data-driven culture. Review of Managerial Science, 17(8), 2655–2684. https://doi.org/10.1007/s11846-022-00596-8
Mitra, S. (2023). How are students learning in a business statistics course? Evidence from both direct and indirect assessment. INFORMS Transactions on Education, 23(2), 95–103. https://doi.org/10.1287/ited.2022.0270
Mrangu, L. (2022). Rubric as assessment tool for lecturers and students in higher education institution. Acta Pedagogia Asiana, 1(1), 26–33. https://doi.org/10.53623/apga.v1i1.98
Wolters, C. A., & Brady, A. C. (2021). College students’ time management: A self-regulated learning perspective. Educational Psychology Review, 33, 1319–1351. https://doi.org/10.1007/s10648-020-09519-z