
C207 QUM3 Task 1 Guide: Regression Analysis Example

C207 QUM3 Task 1 Guide
Updated on: Jul 21, 2026
One Thing Worth Knowing Before You Start
This guide covers QUM3, the Performance Assessment for Task 1 within C207 (Data-Driven Decision Making); you’ll see both terms used throughout, since students search for this assignment both ways. Every QUM3 Task 1 student gets the same scenario — a hospital tracking nurse participation in a wellness program against attrition rates — and one of only three possible datasets, assigned by the last digits of your student ID.
That means a walkthrough using the real scenario would double as an answer key for a meaningful share of everyone taking this course. So this guide teaches the method on a fictitious, structurally identical scenario instead: a retail company examining whether monthly staff training hours predict customer complaint rates. Same shape, same statistics, different numbers; you’ll apply the exact same process to your actual assigned dataset.
Quick Facts
| Course | C207 — Data-Driven Decision Making |
| Assessment | QUM3 — Task 1: Linear Regression Analysis |
| Format | Performance Assessment — regression analysis + written report |
| Software | Excel (Data Analysis ToolPak) strongly recommended for full functionality |
| Rubric aspects | 11 scored components across sections A through F |
| Submission check | Automatic similarity scan and Grammarly for Education review before evaluation |
Assignment Overview
Introduction
Managers are required to organize, interpret, and display data that is reliable and relevant to the real-world decisions they must make in their businesses. The use of analytical tools will improve your ability to use data to make these informed decisions.
In this task, you will address the business situation in the attached “Linear Regression Analysis Resources” scenario. You will access the scenario and dataset by entering your student ID number in the “Start” tab of the attachment, then continuing to the “Scenario” tab. Using this data set, you will perform a linear regression analysis and write a report in which you recommend a solution by summarizing the key details of your analysis.
For full functionality of the scenario and dataset attachment, you are strongly encouraged to use Microsoft Excel, which is available via the Microsoft Office 365 subscription service provided to all WGU students. It can be downloaded using the “Microsoft Office 365” link in the Web Links section.
Scenario
Refer to the scenario located in the attached “Linear Regression Analysis Resources.”
Requirements
Your submission must represent your original work and understanding of the course material. Most performance assessment submissions are automatically scanned through the WGU similarity checker. Students are strongly encouraged to wait for the similarity report to generate after uploading their work and then review it to ensure Academic Authenticity guidelines are met before submitting the file for evaluation. See Understanding Similarity Reports for more information.
You must use the rubric to direct the creation of your submission because it provides detailed criteria that will be used to evaluate your work. Each requirement below may be evaluated by more than one rubric aspect. The rubric aspect titles may contain hyperlinks to relevant portions of the course.
Complete your linear regression analysis and create a report by doing the following:
Note: The supporting document “Linear Regression Analysis Resources” contains a scenario, data set, and data analysis template. While you must use the scenario and data set provided in the supporting document, the template is optional. You are encouraged to use the template to complete your
analysis. Please see supporting document, “QUM Task 1 Getting Started,” for help accessing the scenario and dataset.
A. Summarize the business scenario by doing the following:
- Describe a business question that could be answered by applying linear regression analysis and is derived from the scenario in the attached “Linear Regression Analysis Resources.”
- State the null hypothesis for this linear regression analysis.
- Using relevant details from the scenario, the business question you proposed in part A1, and the null hypothesis you stated in part A2, justify why linear regression is the appropriate analysis technique.
B. Describe the data provided in the attached “Linear Regression Analysis Resources” by doing the following:
- Describe the relevant data characteristics for your linear regression analysis, including each of the following:
- independent variable or variables
- dependent variable
- level of measurement for each variable
- sample size or number of observations
C. Report how you analyzed the data using linear regression by doing the following:
- Provide the output and calculations of the linear regression analysis you performed.
Note: The output should include the output from the software you used to perform the analysis. Refer to “Prepare for the Performance Assessment Task 1” in the course of study to see examples of acceptable output.
2. Create a graphical display of the data using a scatter plot that includes each of the following:
- chart title
- legend
- axis titles
Note: This display should be a summary or representation of the data provided, not raw data.
D. Describe the implications of your data analysis from the scenario by doing the following:
- Interpret the results of the data analysis by doing the following:
a. Discuss the goodness of fit with the supporting test statistic from your linear regression analysis output.
b. Discuss the significance of the independent variable(s) with support from your linear regression analysis results.
c. Create the linear equation, then describe how it can be applied to the scenario in future business decision-making.
2. Discuss a limitation of the research that could affect the recommended course of action.
3. Recommend a course of action that aligns with your linear regression analysis results.
Note: Your recommendation should focus on the results of your analytic technique output from part C1.
E. Acknowledge sources, using in-text citations and references, for content that is quoted, paraphrased, or summarized.
F. Demonstrate professional communication in the content and presentation of your submission.
A1 & A2 — The Business Question and Null Hypothesis
What evaluators check: Your business question has to be derived from the scenario and answerable by linear regression specifically; not just any statistical method. Your null hypothesis needs to be stated accurately for a linear regression context, not a generic “there is no difference” statement borrowed from a t-test template.
How to get this right: A linear regression business question always has the shape “Does [independent variable] predict [dependent variable]?”; resist the urge to write a vague question like “How can we improve X?” That’s a business goal, not an analyzable question.
Example walkthrough — Ferngate Retail Group:
Business question: Does the number of monthly staff training hours predict the customer complaint rate at Ferngate’s retail locations? Null hypothesis: There is no significant linear relationship between monthly staff training hours and customer complaint rate (the regression slope coefficient equals zero).
Notice the null hypothesis is framed specifically around the slope coefficient; that’s what makes it a null hypothesis for linear regression rather than a generic statistical statement.
A3 — Justifying Linear Regression as the Right Technique
What evaluators check: A logical explanation connecting your business question, your null hypothesis, and specific scenario details; not a generic definition of what regression is.
How to get this right: State what you’re trying to predict (a continuous variable), reference that your data pairs two continuous measurements over time, and explicitly connect back to your null hypothesis.
Example walkthrough: “Linear regression is the appropriate technique because Ferngate’s leadership wants to predict a continuous outcome (complaint rate) from a continuous predictor (training hours) using historical monthly data, and to test whether the relationship implied by the null hypothesis — no linear relationship between the two — holds across 24 months of observations.”
B1 — Describing the Data
What evaluators check: All four elements, every time: independent variable, dependent variable, level of measurement, and sample size. Missing even one drops this to “Approaching Competence.”
How to get this right: Treat this as a checklist, not a paragraph you write from memory.
Example walkthrough:
- Independent variable: Monthly staff training hours (ratio-level measurement)
- Dependent variable: Monthly customer complaint rate, expressed as a percentage (ratio-level measurement)
- Sample size: 24 monthly observations
Both variables here are ratio-level because they have a true zero and consistent intervals — worth double-checking against your own variables, since interval vs. ratio is a common point of confusion.

C1 & C2 — Running the Analysis and Building the Scatter Plot
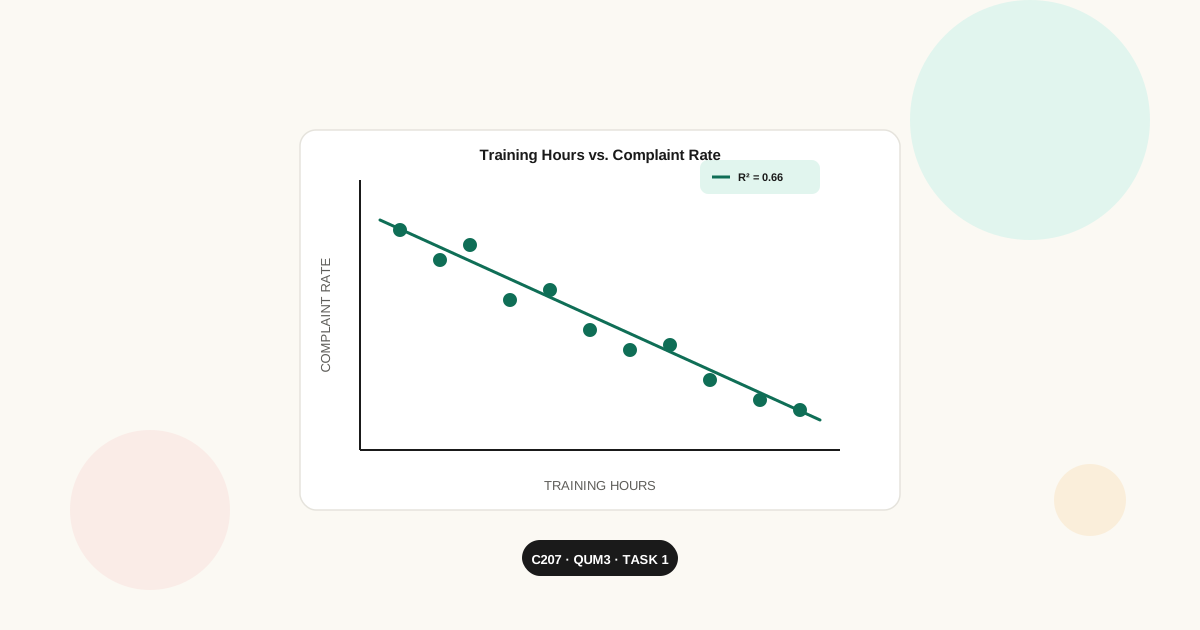
What evaluators check: Accurate output (no calculation errors) for C1; a scatter plot — specifically a scatter plot, not a bar or line chart — with a chart title, legend, and axis titles for C2.
How to get this right: In Excel, use Data > Data Analysis > Regression (enabling the Analysis ToolPak add-in first if it’s not visible). Include the full output table — R, R², coefficients, standard error, and the ANOVA table — not just the final equation. For the scatter plot, plot your independent variable on the x-axis and dependent variable on the y-axis, then add a trendline if you want to visually reinforce the relationship (not required, but it reads well).
Example walkthrough (illustrative regression output):
| Statistic | Value |
|---|---|
| R | 0.81 |
| R² | 0.66 |
| Intercept | 6.9 |
| Slope coefficient | -0.14 |
| P-value (slope) | 0.001 |
| Standard error | 0.038 |
(These figures are fictitious, generated to illustrate the reporting format; not derived from real Ferngate or hospital data.)
D1a — Discussing Goodness of Fit
What evaluators check: The specific test statistic (R²) reported accurately, with an interpretation that’s actually correct; not just “R² is high, so the model is good.”
How to get this right: State the R² value, translate it into a plain-language percentage of variance explained, and avoid the common trap of treating a high R² as automatic proof of a strong, trustworthy model. Recent methodological research has shown that R² and adjusted R² can meaningfully overstate a model’s real explanatory power, particularly with smaller sample sizes — worth a cautious tone here rather than overselling your fit statistic.
Example walkthrough: “The regression model produced an R² of 0.66, indicating that approximately 66% of the variance in customer complaint rate is explained by monthly training hours. While this suggests a moderately strong fit, R² should be interpreted alongside sample size and residual patterns rather than as a standalone measure of model quality.”
D1b — Discussing the Significance of the Independent Variable
What evaluators check: A logical discussion supported by your actual output, comparing the p-value to your significance level (typically α = 0.05) and interpreting that comparison accurately.
How to get this right: State your significance level explicitly, state the p-value from your output, and make the comparison directly — don’t make the reader infer it. A p-value below your threshold means you reject the null hypothesis; above it, you fail to reject it. Avoid the extremely common error of treating a non-significant result as proof there’s no relationship — it only means this dataset didn’t provide strong enough evidence of one.
Example walkthrough: “With a significance level of α = 0.05 and a p-value of 0.001 for the training-hours coefficient, the p-value is less than α, so the null hypothesis is rejected. This indicates a statistically significant linear relationship between monthly training hours and customer complaint rate.”
D1c — The Linear Equation and Its Application
What evaluators check: An accurate equation and a logical explanation of how it applies to future business decisions; not just a restatement of the numbers.
How to get this right: Write the equation in the standard form (ŷ = b₀ + b₁x), then explicitly walk through what happens when you plug in a plausible future value; that’s what makes the “application” requirement land.
Example walkthrough: “The regression equation is ŷ = 6.9 – 0.14x, where x represents monthly training hours and ŷ represents predicted complaint rate. Applying this equation, Ferngate could predict that increasing average monthly training hours from 10 to 15 would be associated with a predicted complaint rate decrease of roughly 0.7 percentage points, informing future staffing and training budget decisions.”
D2 — Identifying a Limitation
What evaluators check: An accurate, scenario-relevant limitation that could genuinely affect whether the recommendation should be trusted.
How to get this right: The strongest, most defensible limitation for almost any regression task built on observational business data is the same one: correlation doesn’t establish causation. Research on how people interpret correlational findings has shown that even carefully-worded “associated with” language tends to be read as causal by default; which is exactly the trap a business recommendation can fall into if it isn’t careful.
Example walkthrough: “A key limitation is that this analysis establishes correlation, not causation. While training hours and complaint rates move together in the historical data, other factors — such as seasonal staffing changes, store location, or management turnover — were not controlled for and could be influencing both variables independently.”
D3 — Recommending a Course of Action
What evaluators check: A recommendation that’s logically tied specifically to your C1 output; not a generic business suggestion that could have been written without the analysis.
How to get this right: Reference your actual coefficient and direction of the relationship explicitly in the recommendation sentence, so the connection to your analysis is unmistakable.
Example walkthrough: “Given the statistically significant negative relationship between training hours and complaint rate identified in this analysis, Ferngate should consider increasing average monthly training hours as part of a pilot program at underperforming locations, while continuing to monitor whether the relationship holds as more data becomes available.”
E & F — Sources and Professional Communication
E (Sources): Cite anything you reference beyond your own analysis, course materials, statistical concepts you look up, or outside sources, with both in-text citations and a reference list. Missing either one caps this at “Approaching Competence” even if your content is otherwise strong.
F (Professional Communication): This one has a built-in safety net; Grammarly for Education scans your submission before you can submit, and the assessment won’t pass without clearing it. Don’t treat that scan as optional; review every flagged issue before moving on, since this rubric line fails on pervasive errors, not just a typo or two.
Still not sure your write-up connects the dots the way evaluators expect? An Assignment Clarity Session walks through your actual output with you — not a hypothetical dataset.
Common Mistakes to Avoid
- Writing a business question that’s interesting but not specifically answerable by linear regression
- Reporting R² without any interpretation of what it actually means for the business
- Treating a non-significant p-value as proof of “no relationship” rather than “not enough evidence in this data”
- A D1c equation explanation that restates the numbers instead of applying them to a future scenario
- Skipping the correlation-vs-causation limitation in favor of a vaguer, less defensible one
- Submitting before reviewing the Grammarly for Education feedback
Perfect-Score Self-Check
- Does my business question name both variables and fit the “does X predict Y” shape?
- Is my null hypothesis specifically about the regression slope, not a generic statistical statement?
- Have I included all four data-description elements in B1?
- Does my C1 output include the full table, not just the final numbers?
- Is my C2 chart actually a scatter plot with all three required elements?
- Did I compare my p-value to my stated significance level explicitly in D1b?
- Does my D3 recommendation reference my specific analysis results, not just general advice?
- Have I cleared the Grammarly for Education check?
References & Further Reading
- Qi, J. (2023). How Much Should We Trust R2 and Adjusted R2: Evidence from Regressions in Top Economics Journals and Monte Carlo Simulations. Journal of Applied Economics, 26(1), Article 2207326. — A recent peer-reviewed paper demonstrating that R² and adjusted R² can overstate a model’s true explanatory power, directly relevant to how you should frame a goodness-of-fit discussion.
- Gershman, S. J., & Ullman, T. D. (2023). Causal Implicatures from Correlational Statements. PLOS ONE, 18(5), e0286067. — A peer-reviewed study showing that people default to reading correlational findings as causal, even when the language is carefully hedged — the exact trap this guide’s limitation section is built to help you avoid.
- Manda, P. R., et al. (2023). Misinterpretations of Significance Testing Results Near the P-Value Threshold. Cureus. — A recent peer-reviewed audit of how often researchers misreport statistical significance near the threshold; the underlying statistical literacy issue applies just as much to business analytics as to the clinical research context it examines.
Related Resource
WGU C207 Task 2 Guide: How to Nail Every Rubric Line on Your Decision Tree Analysis
Frequently Asked Questions
Is the hospital/nurse wellness scenario used in this guide’s examples? No. Every C207 QUM3 Task 1 student receives the same scenario and one of three shared datasets, so this guide uses a fictitious retail scenario (Ferngate Retail Group) to demonstrate the method without answering the actual shared prompt.
Does this guide give me the answers to my specific dataset? No — and it can’t, since your dataset is one of three assigned by your student ID and not visible to us. What this guide gives you is the exact rubric-by-rubric method, demonstrated on fictitious numbers, so you can apply the same process to your real output.
What software should I use for the regression analysis? Excel with the Data Analysis ToolPak add-in is what WGU recommends and what this guide’s walkthrough assumes. If the ToolPak isn’t visible in your Data tab, it needs to be enabled through Excel’s Add-ins settings first.
Is getting help with this task against WGU’s academic integrity policy? Tutoring, coaching, and editing support are a normal, accepted part of studying — most university policies explicitly support students getting this kind of help. Our role is to help you understand and interpret your own output, which fits well within that.