
WGU D361 Task 2 Guide: Competitive Analysis (SWOT, Strategic Graphs, SMART Goals)

WGU D361 Task 2 Guide: Competitive Analysis (SWOT, Strategic Graphs, SMART Goals)
Six quarters behind you. Now the harder question: what do they actually mean for what comes next?
Executive Summary
D361 Task 2 asks you to step back from the quarter-by-quarter decisions of Task 1 and assess your simulated business’s overall competitive position — a SWOT analysis, an interpretation of your strategic market graphs, and one forward-looking SMART goal. The skill being tested is synthesis: can you look at six quarters of your own history and turn it into a coherent strategic argument, not four disconnected sections that happen to share a cover page.
Before You Begin
- Confirm Task 1 is passed. Task 2 cannot be submitted until this is confirmed — don’t draft ahead assuming it’ll clear.
- Be in Quarter 7 of the simulation specifically to access the final strategic line graphs, which cover the full Quarters 1–6 history.
- Your SWOT should reflect the business as of the end of Quarter 6 — not Quarter 7. This is an easy detail to miss and worth double-checking before you write anything.
- Skim all 21 available Market-section graphs before picking your three. The graphs must come specifically from the Market section — not other report areas.
- Note that sources are optional here, unlike Task 1 — you’re not required to cite the simulation itself, and outside sources are only needed if you actually use them.
The Assignment: D361 Task 2 – Competitive Analysis
The graduate applies the competencies from across the business core curriculum, demonstrating the ability to lead the implementation of the mission, strategy, and goals of an organization.
Introduction
For this task, you will create a report on the competitive position of the company from your completed Marketplace Simulations business simulation referenced in Task 1.
You must receive confirmation that you successfully passed Task 1: Business Performance Report before submitting Task 2: Competitive Analysis of this performance assessment.
Scenario
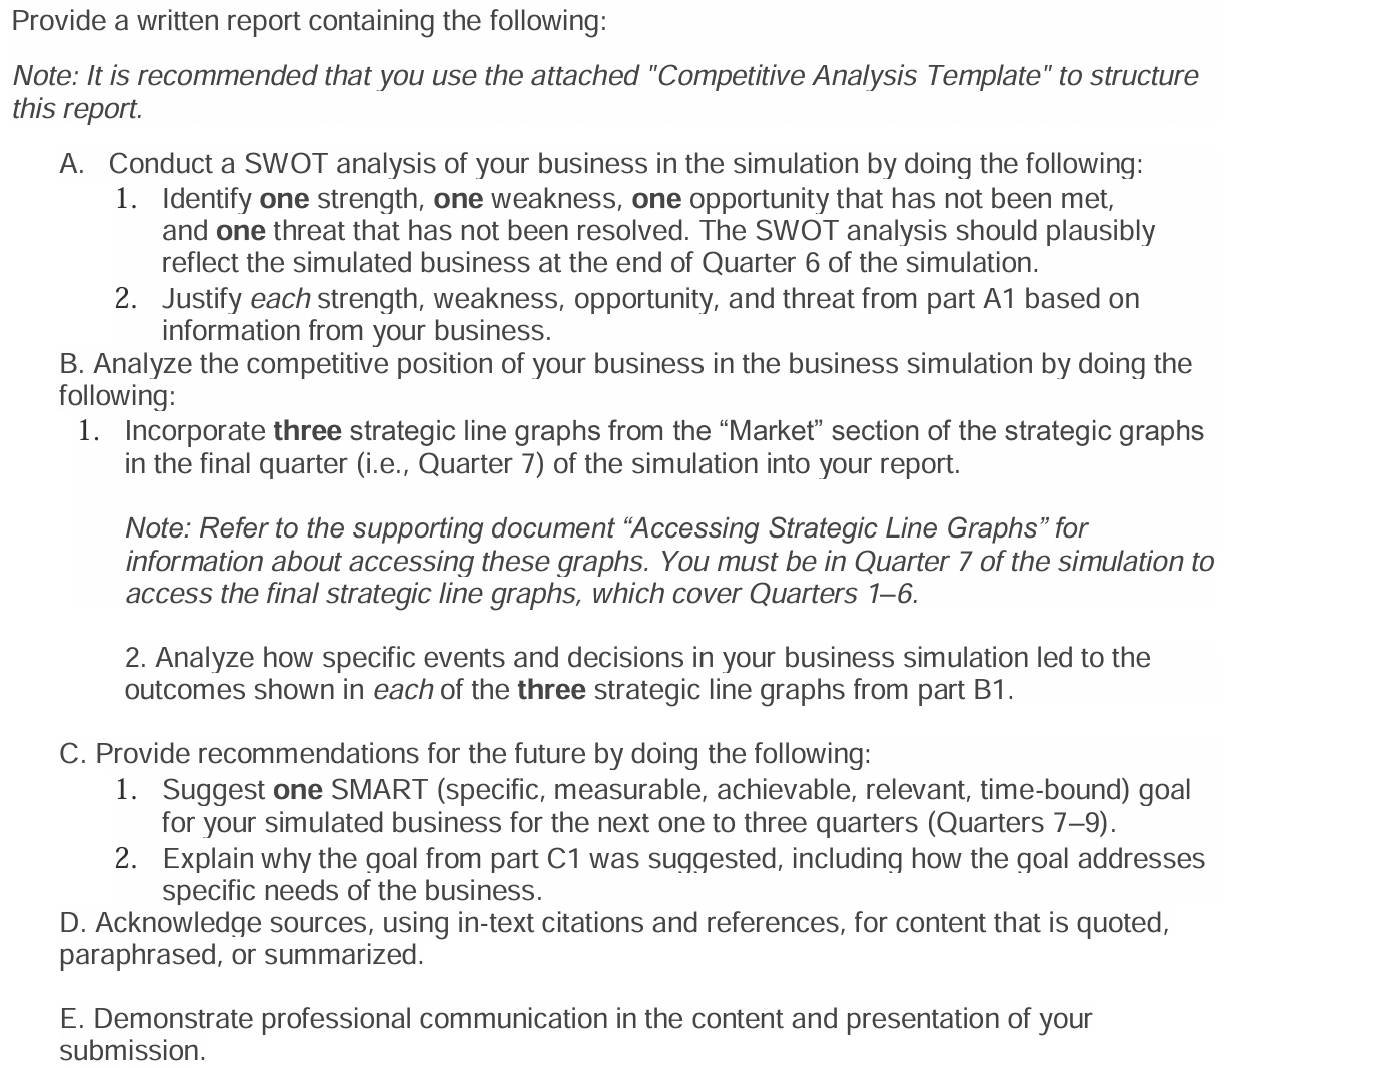
As a leader in your business, you are responsible for reporting to other stakeholders about the competitive position of your business during its first six quarters. Your report will provide an analysis of strengths, weaknesses, opportunities, and threats (SWOT) facing the business. It will also address the competitive position of the business in the marketplace and organizational goal setting.
Understanding the Assignment
Three functional parts, each testing something different:
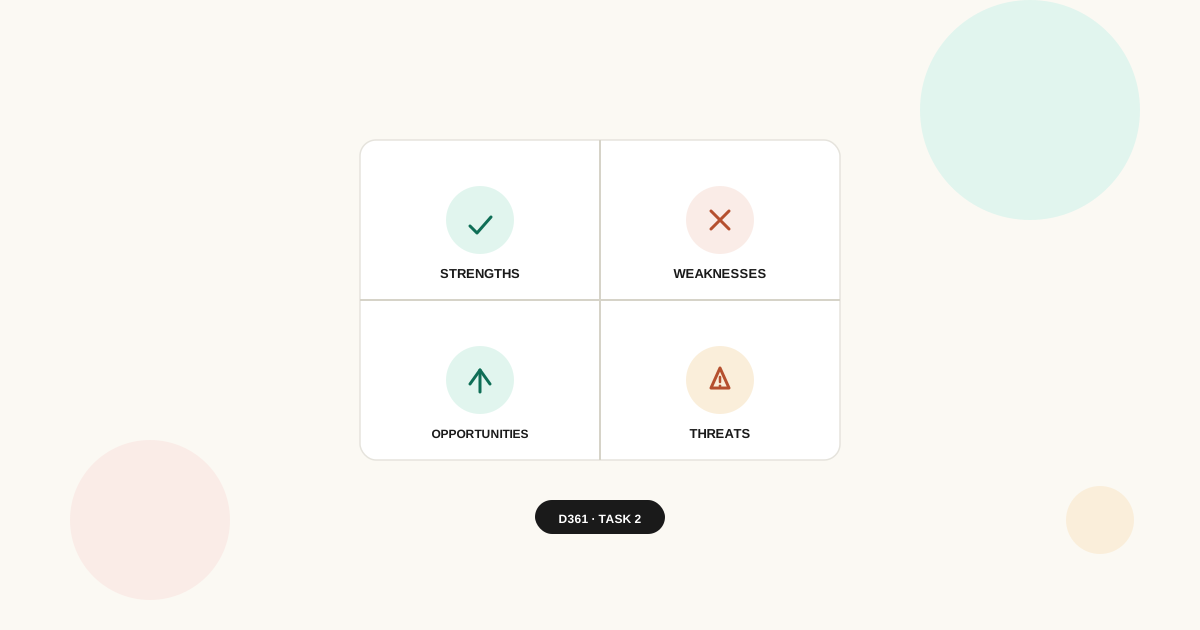
- Part A (SWOT) tests whether you can honestly assess your own business’s position — one real strength, one real weakness, one still-unmet opportunity, one still-unresolved threat.
- Part B (Competitive Analysis) tests whether you can read your own strategic data and connect it to specific decisions you made, not just describe what a graph shows.
- Part C (Recommendations) tests whether you can translate that analysis into one concrete, well-formed forward-looking goal.
Why WGU Uses This Assignment
Every business leader eventually has to answer a version of this exact question: given where we are and how we got here, what should we do next? Task 1 tested whether you could explain a specific past decision’s financial consequence. Task 2 tests something one level up — whether you can synthesize an entire strategic position and commit to a defensible next move, which is a distinctly different, more senior skill than explaining a single quarter’s numbers.
Part A: SWOT Analysis
What SWOT actually is: Strengths and Weaknesses are internal — things within your control (pricing, staffing, production capacity, marketing spend). Opportunities and Threats are external — driven by competitors and market conditions you don’t directly control.
The constraint worth reading twice: your Opportunity must be one that “has not been met,” and your Threat must be one that “has not been resolved.” This isn’t a minor wording detail — picking an opportunity you already captured, or a threat you already neutralized, doesn’t satisfy the requirement, since the point is identifying what’s still actionable heading into Quarters 7–9.
A Correction Worth Knowing
Here’s something genuinely useful that most quick explanations of SWOT get wrong. The popular story credits either Albert Humphrey or four Harvard Business School professors with inventing SWOT analysis in the 1960s. Recent peer-reviewed historical research — based on archival research and direct interviews with the people involved — found this popular origin story doesn’t hold up. The technique actually began as “SOFT” (Satisfactory, Opportunities, Faults, Threats) at the Stanford Research Institute in the mid-1960s, developed under Robert Franklin Stewart, and was only later relabeled to the SWOT acronym still in use today. The “Harvard professors” attribution traces to what the researchers call an “academic urban legend” rather than the actual historical record.
This isn’t just trivia — understanding that SWOT originated as a dialogue-based planning process (managers grading planning issues with evidence, discussing them across the organization) rather than a static four-box template reinforces exactly what the rubric is testing: your Strengths, Weaknesses, Opportunities, and Threats need to be evidenced and argued, not just listed.
A2 — Justification: each of the four components needs its own evidence-based justification tied to your specific six quarters — not an assertion. Treat this the same way Task 1 asked you to trace a decision to a financial statement line: name the specific evidence (a metric, a trend, a competitor action) behind each SWOT component.

Part B: Competitive Analysis (Strategic Graphs)
B1 — Selecting three graphs: They must come specifically from the Market section of the Quarter 7 strategic graphs (which cover Quarters 1–6), complete with legend and full context. With 21 options available, the strongest submissions choose three graphs that work together to tell one coherent competitive story — for example, Market Share, Total Clicks, and Advertising Expenses could together tell a connected story about a marketing-driven share gain, rather than three unrelated metrics that don’t build on each other.
B2 — Analysis: This is where most points are actually won or lost. The rubric wants you to tie each graph’s trend back to a specific decision you made — not a general description of what the line shows. Many of these graphs include competitor data alongside your own, which is worth using directly: a strong analysis often explains your position relative to a competitor’s visible move, not just your own trajectory in isolation.
Recent peer-reviewed research on business simulation games specifically found that simulations are most effective at developing genuine decision-making skill when students are pushed to analyze and justify the connection between their choices and the resulting outcomes — not simply observe results passively. That’s precisely the difference between a B2 response that describes a graph and one that argues from it.
Part C: Recommendations (SMART Goal)
The actual origin of SMART, briefly: the framework was introduced by George Doran in a 1981 article in Management Review, originally standing for Specific, Measurable, Assignable, Realistic, and Time-related (the “A” and “R” have shifted slightly across later popularizations — WGU’s version uses Achievable and Relevant). Doran’s original point, often lost in later simplifications, was that not every objective needs to hit all five criteria with equal rigor — some objectives are better served by a clear action plan than by forcing an artificial numeric target. For this task, though, the rubric expects all five criteria addressed explicitly.
C1 — The goal itself: one goal, covering hypothetical Quarters 7–9. The checklist’s own example is instructive: “be the market share leader in the speed industry” is not SMART — it’s an ambition with no number, no specific segment, and no deadline. “Have 40% market share for the Millennial Speed bike by the end of Quarter 8” is SMART — specific segment, specific number, specific date.
C2 — Explanation: don’t just restate the goal. Explain why it was chosen and connect it explicitly to a specific business function — marketing, operations, HR, R&D — the same way Task 1 asked you to name a specific expense line, not just describe a general trend.
Parts D & E: Sources and Professional Communication
Part D is genuinely optional here — a meaningful difference from Task 1. You don’t need to cite the simulation itself, and most students complete this task without any outside sources at all. If you do reference something external, cite it properly; otherwise, don’t force citations in where they aren’t needed. Part E is the same Grammarly for Education gate as every other performance assessment — review the feedback before submitting.
A Full Walkthrough (Fictitious Company — Ridgeline Cycles)
Continuing the same fictitious company from the D361 Task 1 guide, here’s how the three sections fit together — entirely fictitious, not drawn from any real student’s simulation data.
SWOT (reflecting end of Quarter 6):
- Strength: Strong brand recognition in the urban commuter segment, evidenced by above-average unit sales growth following the Quarter 3 targeted advertising campaign.
- Weakness: Thin supplier redundancy — the Quarter 4 capacity issue with the recline-mechanism supplier exposed a single point of failure in the production chain.
- Opportunity (unmet): A competitor’s declining presence in the “speed” segment, visible in Quarter 5–6 market share data, not yet pursued by Ridgeline.
- Threat (unresolved): A larger competitor’s growing internet marketing spend and click volume, visible in Quarter 6 data, actively eroding Ridgeline’s digital visibility.
Graph interpretation (sample): A “Market Share” graph showing Ridgeline’s share climbing steadily from Quarter 3 onward ties directly back to the Quarter 3 marketing decision covered in the Task 1 guide — the graph’s inflection point lines up with the campaign’s launch, not a coincidence worth leaving unstated.
SMART goal: “Increase Ridgeline’s market share in the urban commuter segment specifically to 35% by the end of Quarter 9, through expanded digital marketing targeting the underserved 25–34 demographic identified in Quarter 6 data.” This names a specific segment, a specific number, a specific demographic rationale, and a specific deadline — while connecting explicitly back to the marketing function.
Common Mistakes
- Choosing an Opportunity or Threat that’s already been resolved, which directly violates the A1 requirement
- Writing SWOT components that sound generic rather than genuinely specific to your own six quarters
- Selecting three graphs that don’t connect into one coherent competitive narrative
- Describing what a graph shows without naming the specific decision that produced it
- Writing a SMART goal that’s really just a restated ambition, missing a number or a deadline
- Forgetting the Quarter 6-vs-Quarter 7 timing distinction for the SWOT
Self-Assessment Checklist
- Are all four SWOT components specific to my own business, evidenced rather than asserted?
- Is my Opportunity genuinely unmet and my Threat genuinely unresolved, as of Quarter 6?
- Do my three graphs build one coherent story rather than three disconnected data points?
- Does every graph analysis name a specific decision, not just describe a trend?
- Does my SMART goal hit all five criteria explicitly?
- Does my C2 explanation connect the goal to a specific business function?
Frequently Asked Questions
Do I need outside sources for this task? No — most students complete Task 2 without any outside sources, and the simulation itself never requires citation. Only cite something if you actually reference outside material.
Can my SWOT reflect Quarter 7 instead of Quarter 6? No — the rubric specifically asks for the business as it stood at the end of Quarter 6, even though you’re accessing the graphs from within Quarter 7.
Do the three strategic graphs need to be related to each other? Not strictly required, but strongly recommended — three graphs that build one coherent competitive story make Part B2’s analysis significantly easier to write well than three unrelated metrics.
What makes a SMART goal “achievable” in a simulation context? Ground it in your actual Quarter 6 trajectory — a goal that would require an implausible jump from your current trend line is harder to justify as achievable than one that extends a trend already in motion.
Is getting help with this task against WGU’s academic integrity policy? Tutoring, coaching, and editing support are a normal, accepted part of studying — most university policies explicitly support students getting this kind of help.
Related Learning Resources
- WGU D361 Task 1 Guide: Business Performance Report
- Strategic Planning Basics
- Business Decision Making Frameworks
- Understanding Business Ratios
- Marketing ROI, Explained
Need Help With D361 Task 2?
Turning six quarters of simulation history into a coherent SWOT, a connected graph analysis, and one well-formed SMART goal is a genuinely different skill than Task 1’s quarter-by-quarter analysis. If you’re not sure your graphs tell one story, or whether your SMART goal actually hits all five criteria, an Assignment Clarity Session walks through your actual results with you.
References & Further Reading
- Puyt, R. W., Lie, F. B., & Wilderom, C. P. M. (2023). The Origins of SWOT Analysis. Long Range Planning, 56(3), Article 102304. — A peer-reviewed historical study using archival research and direct interviews to correct the popular but inaccurate account of SWOT analysis’s origins, tracing it to Robert Franklin Stewart’s SOFT approach at the Stanford Research Institute in the 1960s rather than the commonly credited Harvard Business School story.
- Doran, G. T. (1981). “There’s a S.M.A.R.T. Way to Write Management’s Goals and Objectives.” Management Review, 70(11), 35–36. — The original primary source introducing the SMART framework, cited directly here since it’s the actual origin of the model this section applies, not a later secondary summary of it.
- Vélez, A., & Alonso, R. K. (2025). Business Simulation Games for the Development of Decision Making: Systematic Review. Education Sciences, 15(2), 168. — A recent peer-reviewed systematic review finding that business simulation games most effectively build decision-making skill when students actively analyze and justify the connection between their choices and resulting outcomes, the basis for this guide’s emphasis on tying graph trends to specific decisions rather than describing them passively.