
WGU D361 Task 1 Guide: Business Performance Report (Marketplace Simulation)

WGU D361 Task 1 Guide
Six quarters of decisions. One report that has to prove you understood why any of them mattered.
Executive Summary
D361 Task 1 asks you to evaluate the performance of a simulated business using financial statements and operational data generated by the Marketplace Simulation. The trap is treating this as a reporting exercise; restating numbers from your Income Statement and calling it analysis. It isn’t. WGU is testing whether you can trace a strategic decision through to its financial consequence and explain that chain of cause and effect the way an actual executive would in a board meeting. This guide teaches that analytical framework, using your own simulation results as the raw material.
Assignment – D361 Task 1: Business Performance Report
Introduction
Before you begin this task, you must complete and pass the Marketplace Simulation business simulation with a score of 0.001 or higher. If the simulation is not completed with the passing cut score of 0.001 or higher, your task will be returned, and you will be required to contact your instructor and re-play the simulation.
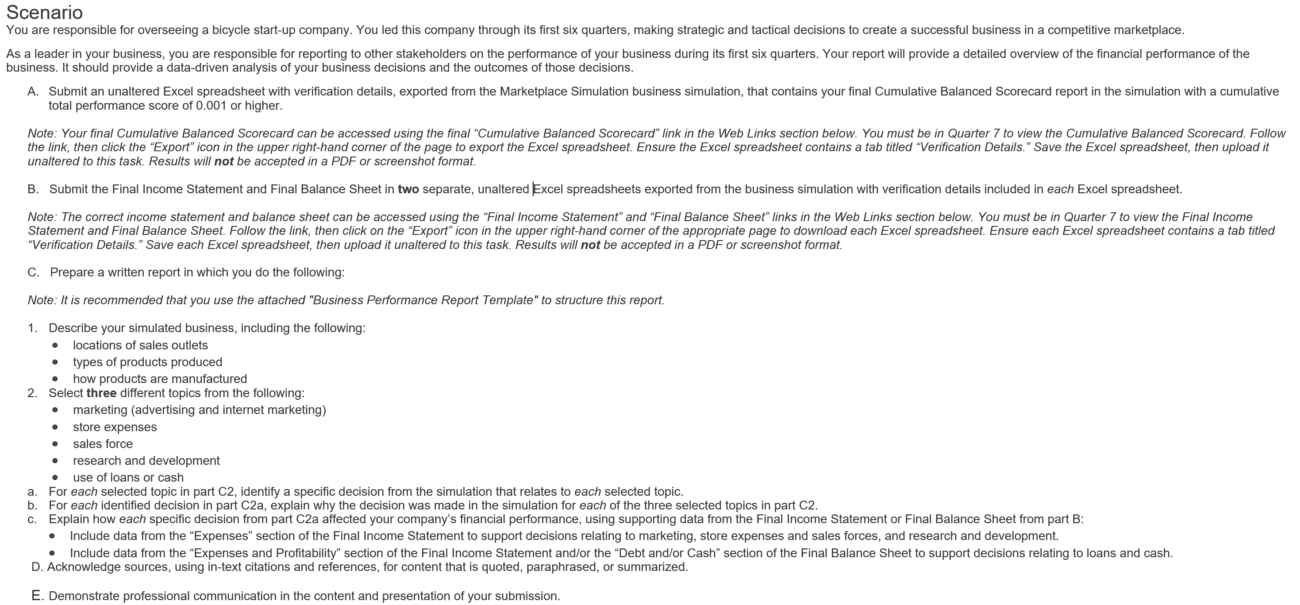
Note: When completed, you will upload four total documents: three Excel spreadsheets with verification details and the attached “Business Performance Report Template” in a Word or PDF format. Your four documents should be as follows:
- Cumulative Balanced Scorecard
- Final Income Statement
- Final Balance Sheet
- Business Performance Report Template
In this task, you will provide evidence of the successful completion of the Marketplace Simulation business simulation and then produce a written report using the attached “Business Performance Report Template” to analyze the performance of your simulated business.
You must receive confirmation that you successfully passed Task 1: Business Performance Report before submitting Task 2: Competitive Analysis of this performance assessment
Understanding the Assignment
This assessment measures your ability to connect business strategy with measurable business performance. It isn’t asking you to prove you can operate the simulation; it’s asking you to prove you understand what your decisions actually did once they hit the financial statements. That means demonstrating strategic decision-making, financial analysis, operational awareness, and integrated business thinking simultaneously, in a single report, using your own six quarters of data as evidence.
Why WGU Uses the Marketplace Simulation
Business leaders rarely make isolated decisions. Marketing spend affects revenue. Operational choices affect cost structure. R&D investment affects competitive position two quarters later, not immediately. A loan affects liquidity today and interest expense for every quarter after. Most business coursework teaches these relationships one at a time, in isolation; a marketing course teaches marketing, a finance course teaches finance. The Marketplace Simulation forces you to make decisions across all of these levers at once and then live with the compounding consequences, which is a much closer approximation of what actually running a business feels like than any single-subject case study.
That’s also why this task resists a formulaic answer. Your simulation results are yours — no two students’ six quarters look the same — so the skill being tested isn’t “know the right answer,” it’s “read your own results accurately and explain them well.”
Before You Begin
- Confirm your Cumulative Balanced Scorecard shows a passing score of 0.001 or higher; Task 1 gets returned without it
- Export all three required spreadsheets (Cumulative Balanced Scorecard, Final Income Statement, Final Balance Sheet) directly from the simulation in Quarter 7, unaltered; screenshots and PDFs aren’t accepted
- Confirm each exported spreadsheet includes a “Verification Details” tab before you upload anything
- Review the rubric in full before drafting; several parts (C2a, C2b, C2c) build directly on each other
- Skim all six quarters of your own decisions before picking your three topics; don’t just default to whichever quarter you remember best
Understanding the Marketplace Simulation
The simulation puts you in charge of a startup competing across several interconnected levers: business strategy, pricing, manufacturing, marketing, R&D, financing, and production planning, all while responding to competitor behavior and shifting customer demand. Every quarter, your decisions in one area create downstream effects in others; a pricing change affects demand, which affects production planning, which affects capacity utilization, which affects cost per unit. None of these levers operate independently, which is exactly the point: the simulation is testing whether you can manage a system, not optimize a single variable.
Understanding the Reports
What Is the Balanced Scorecard?
The Balanced Scorecard is a performance-measurement framework that deliberately looks beyond pure financial results, evaluating a business across four perspectives:
- Financial — profitability, revenue growth, cost control
- Customer — market share, customer satisfaction, brand awareness
- Internal Processes — operational efficiency, production quality, capacity utilization
- Learning and Growth — innovation, R&D investment, organizational capability
Managers use it because a business that looks strong financially in one quarter can be quietly eroding its customer base or under-investing in future capability; the Balanced Scorecard is designed to surface that kind of imbalance before it shows up as a financial problem later.
Understanding the Income Statement
The Income Statement tells you whether the business made money over a period, and how. The key lines worth understanding cold before you write anything:
- Revenue — total sales generated
- Gross Profit — revenue minus the direct cost of producing what you sold
- Operating Expenses — the costs of running the business day to day, including marketing expense, sales expense, and R&D expense specifically
- Operating Income — what’s left after operating expenses, before interest and taxes — this is often the clearest single measure of how well the core business is actually performing
- Net Income — the true bottom line, after everything, including interest on any loans
The reason this matters for D361 specifically: your C2c requirement explicitly asks you to cite the Expenses section of your Income Statement to support decisions about marketing, store expenses, sales force, and R&D — so you need to be reading this statement with intent, not just skimming it for a net income figure.
Understanding the Balance Sheet
The Balance Sheet is a snapshot of what the business owns and owes at a single point in time — Quarter 7, in your case. Key concepts:
- Assets — what the business owns (cash, inventory, equipment)
- Liabilities — what the business owes (loans, accounts payable)
- Equity — the residual value belonging to owners once liabilities are subtracted from assets
- Working Capital — current assets minus current liabilities, a measure of short-term financial health
- Debt and Cash position — directly relevant if you choose “use of loans or cash” as one of your three topics, since this is where financing decisions show up concretely
Understanding Financial Performance
A few concepts worth knowing before you start writing, since strong D361 reports use this vocabulary precisely rather than loosely:
- Profitability — the ability to generate income relative to revenue or investment
- Liquidity — the ability to meet short-term obligations, closely tied to cash position
- Efficiency — how well the business converts inputs (costs, assets) into outputs (revenue, profit)
- Leverage — the extent to which the business relies on debt financing
- Growth — change in revenue, market share, or scale over time
- Risk — exposure to conditions that could threaten financial stability
Choosing the Three Topics
You’ll select three from: marketing, store expenses, sales force, R&D, or use of loans/cash. There’s no universally “correct” three; the right choice depends on two things specific to your own simulation run:
- Clarity of decision — did you make a specific, identifiable decision in this area, or did it mostly run on autopilot?
- Strength of evidence — can you point to a specific line item in your Income Statement or Balance Sheet that clearly reflects the outcome of that decision?
A topic where you made a bold decision but can’t clearly trace its financial effect is a weaker choice than a topic with a smaller decision but crystal-clear supporting data. Evidence strength beats decision drama every time in this task.
Marketing — decisions typically center on advertising spend and digital/internet marketing investment, evaluated against revenue growth and brand awareness shifts.
Store Expenses — decisions about facility investment and operational cost control, evaluated against cost efficiency and operating expense trends.
Sales Force — decisions about hiring, training, or expanding your sales team, evaluated against sales productivity and revenue.
Research and Development — decisions about innovation and product improvement investment, evaluated against competitive differentiation and — often with a lag — future sales.
Use of Loans or Cash — financing decisions, evaluated against liquidity, interest expense, and overall financial flexibility.
The Business Decision Framework
This is the actual structure evaluators are looking for, whether or not the rubric spells it out in these exact terms:
Business Goal → Decision → Business Impact → Financial Result → Evidence → Management Lesson
Compare the difference this makes:
Weak: “I increased advertising.”
Strong, using the framework: “Facing flat sales in Quarter 3 [business goal], I increased the advertising budget by targeting a new customer segment [decision]. This expanded market reach and drove higher unit sales in Quarter 4 [business impact], which appeared as a revenue increase alongside a corresponding rise in marketing expense on the Income Statement [financial result, evidence]. The lesson: advertising increases paid off when targeted at an underserved segment, not just increased spending in general [management lesson].”
This is exactly the reasoning pattern an executive uses to justify a decision to a board — not “I did X,” but “I did X, because Y, and here’s the proof it worked.”
Connecting Decisions to Financial Statements
Every real business decision should be traceable to a specific line item. If it isn’t, either the decision wasn’t as significant as you think, or you haven’t found the right evidence yet. The typical chains:
- Marketing decision → Advertising Expense (Income Statement) → Revenue growth
- R&D decision → R&D Expense (Income Statement) → Future sales, often with a lag of a quarter or more
- Loan decision → Interest Expense (Income Statement) / Debt position (Balance Sheet) → Cash flow and liquidity
- Sales force decision → Selling Expense (Income Statement) → Revenue
Notice that every chain ends in a number you can point to — that’s what separates analysis from narration.
How to Support Every Claim
Weak: “I increased marketing because it felt like the right move.”
Strong: “I increased advertising investment, which corresponded with higher sales revenue in the following quarter, while also increasing the marketing expense line recorded on the Income Statement.”
The difference isn’t length — it’s that the strong version names a specific financial statement line and a specific direction of change. Every claim in your report should survive the question “where exactly does that show up in my numbers?”

A Full Walkthrough (Fictitious Company — No Marketplace Data Used)
To demonstrate the method without using any real simulation output, here’s a walkthrough for a fictitious bicycle startup, Ridgeline Cycles, across three topics.
C1 — Business Overview (demonstration only)
Ridgeline Cycles sells direct-to-consumer through two regional outlets and an online storefront, manufacturing mid-range commuter bicycles at a single domestic production facility.
C2 – Three Different Topics
Topic 1 — Marketing
Decision: In Quarter 3, facing stagnant unit sales, Ridgeline increased its digital advertising budget by 40%, shifting spend toward targeted social media campaigns aimed at urban commuters.
Why: Prior quarters showed flat demand despite adequate production capacity; the bottleneck was market awareness, not supply.
Financial impact: Marketing expense on the Income Statement rose accordingly in Quarter 3, and unit sales revenue increased 18% by Quarter 4; a lagged but clearly attributable effect, consistent with how digital campaigns typically take a quarter to fully convert.
Topic 2 — Research and Development
Decision: In Quarter 2, Ridgeline invested in R&D for a lighter aluminum frame design, aiming to differentiate from lower-cost competitors.
Why: Competitive analysis showed Ridgeline’s original frame design was underperforming on customer preference scores relative to competitors.
Financial impact: R&D expense increased in Quarter 2 with no immediate revenue effect; but by Quarter 5, after the new frame reached production, average selling price and customer satisfaction scores both rose, reflected in improved gross margin on the Income Statement. This lag is worth naming explicitly in your own report if you see the same pattern; R&D often shows delayed payoff, and pointing that out demonstrates real understanding, not just number-matching.
Topic 3 — Use of Loans and Cash
Decision: In Quarter 4, Ridgeline took out a short-term loan to fund a temporary inventory expansion ahead of an anticipated seasonal demand spike.
Why: Cash reserves alone were insufficient to cover the inventory buildup without risking a stockout during peak demand.
Financial impact: The Balance Sheet shows increased debt in Quarter 4, with a corresponding interest expense on the Income Statement in subsequent quarters; offset by the fact that the anticipated demand spike materialized, and revenue growth in Quarter 5 outpaced the added interest cost, a tradeoff worth explicitly evaluating rather than just reporting.
This is the shape and depth your own three topics need — a business goal, a specific decision, a named financial statement line, and an honest evaluation of whether the tradeoff paid off — built from your own six quarters of actual simulation data rather than this fictitious one.
Understanding Cause and Effect
The single biggest lesson this task is built to teach: business decisions create financial consequences, sometimes immediately and sometimes with a lag. The pattern to internalize:
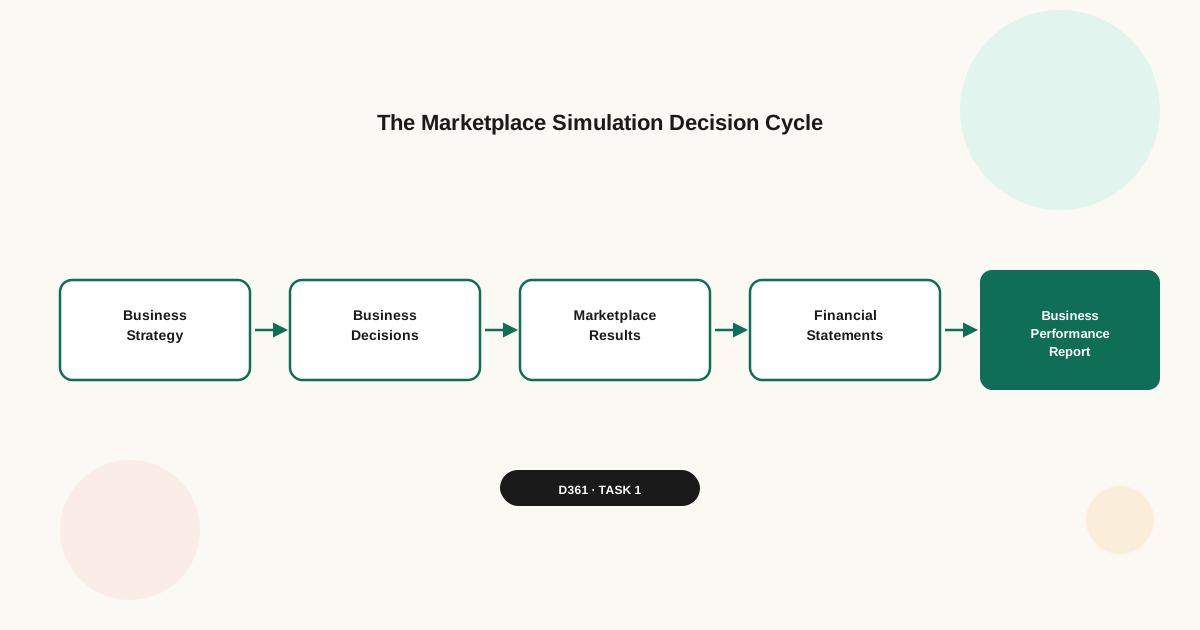
Decision → Operational Change → Financial Impact → Business Performance → Future Strategy
A strong report doesn’t just identify this chain once — it recognizes that the chain often loops. This quarter’s financial result becomes the basis for next quarter’s decision, which is exactly the kind of iterative thinking real business leadership requires.

Common Mistakes
- Describing a decision without explaining why it was made
- Listing financial numbers without interpreting what they mean
- Treating your three topics as unrelated, when the strongest reports show how they interacted
- Using opinion or intuition (“it felt right”) instead of citing financial evidence
- Confusing revenue growth with profit growth — a strong quarter for one doesn’t guarantee the other
- Never explicitly naming which financial statement line supports a given claim
- Picking a topic because it sounds impressive rather than because you have strong supporting data for it
Self-Assessment Checklist
- Have I described my simulated company specifically — locations, products, manufacturing approach?
- Have I selected three topics where I have both a clear decision and strong supporting evidence?
- Have I explained why each decision was made, not just what the decision was?
- Have I supported every conclusion with a specific line item from my Income Statement or Balance Sheet?
- Have I connected strategy to performance explicitly, rather than describing them side by side?
- Would an executive reading this understand my reasoning without needing to ask a follow-up question?
Frequently Asked Questions
Which three topics should I choose? Whichever three give you the clearest decision paired with the strongest financial evidence in your own results — not necessarily the three that sound most strategic in the abstract.
Can I discuss the same financial statement twice across different topics? Yes — the Income Statement in particular will likely support more than one of your three topics, since marketing, sales force, and R&D expenses all live in the same Expenses section.
Do I need to include actual calculations in my report? The task doesn’t require formal ratio calculations, but citing specific figures (dollar amounts, percentage changes) from your statements makes your evidence far more concrete than a general description.
How much financial data should I reference? Enough that a reader could verify your claim by looking at the same line item themselves — vague references (“expenses went up”) are weaker than specific ones (“marketing expense increased by approximately $12,000 in Quarter 3”).
What if one of my decisions produced poor results? That’s still valid material — the rubric asks you to explain the impact of a decision, not to prove every decision succeeded. A well-reasoned explanation of a decision that didn’t pay off, including what the data shows about why, often demonstrates stronger analytical thinking than a report where everything worked out perfectly.
Can negative outcomes still receive full marks? Yes, provided your analysis is logical, well-supported by your actual data, and clearly explains the connection between the decision and the result — the rubric evaluates your reasoning, not whether your simulated business had a perfect run.
Related Learning Resources
- WGU D361 Task 2 Guide: Competitive Analysis (SWOT, Strategic Graphs, SMART Goals)
- Balanced Scorecard Explained
- Income Statement Guide
- Balance Sheet Explained
- Understanding Business Ratios
- Financial Analysis Fundamentals
- Marketing ROI, Explained
- Understanding Working Capital
- Business Decision Making Frameworks
- Strategic Planning Basics
- Managerial Accounting Concepts
References & Further Reading
- Sansone, D. (2023). Financial Analysis for Small Business Owners. Journal of Finance and Marketing, 7(4), 193. — A peer-reviewed examination of why financial analysis skill gaps persist even among capable business owners and managers, and how developing this skill directly improves decision quality — the basis for this page’s framing of financial analysis as a learnable, practiced skill.
Need Help Understanding D361 Task 1?
The Marketplace Simulation requires you to connect strategic decisions with financial outcomes — a skill that takes practice to develop, especially while reading your own six quarters of results for the first time. If you’re unsure how to interpret your reports, choose your three topics, or explain your decisions using financial evidence, an Assignment Clarity Session walks through your actual results with you.